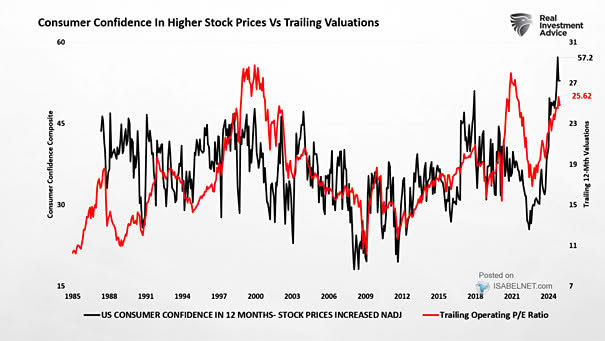
S&P 500 Performance During and After Government Shutdowns

S&P 500 Performance During and After Government Shutdowns Even the longest government shutdown in U.S. history couldn’t rattle Wall Street. Stocks held firm—and historically, once Washington gets back to work, equities have gained an average…

Valuation – S&P 500 Real Value Index

Valuation – S&P 500 Real Value Index Since 1871, the S&P 500 real total returns, dividends reinvested, have averaged 6.9% a year. The U.S. Real Value Index has always mean-reverted — and right now, it…

U.S. Labor Productivity

U.S. Labor Productivity A pandemic-driven productivity surge has put U.S. real output per hour 1.7% above its previous trajectory, providing tailwinds to economic performance and keeping the American growth story alive and well. Image: Deutsche…

Bitcoin Price and 365-Day Moving Average

Bitcoin Price and 365-Day Moving Average A break below the 365-day moving average puts Bitcoin on the defensive. Add in thin dip demand, margin pressure, and souring sentiment, and the setup looks ripe for institutional…

S&P 500 Valuations Based On Forward Operating EPS

S&P 500 Valuations Based On Forward Operating EPS Easy money and low rates could keep pushing S&P 500 multiples higher, but the risk is that earnings won’t rise fast enough to support them. For the…

AAII Bulls Minus Bears and S&P 500 Returns

AAII Bulls Minus Bears and S&P 500 Returns The AAII bulls minus bears sentiment spread in 2025 has mirrored bear market extremes from history, reflecting deep pessimism over near‑term stock performance — but to contrarians,…

Valuation – S&P 500 Index Forward P/E Ratio

Valuation – S&P 500 Index Forward P/E Ratio The market is no bargain: the S&P 500 sits at 23 times forward earnings, versus 16 on average over two decades, while the Magnificent Seven stretch valuations…