Total Known Gold ETFs Holdings
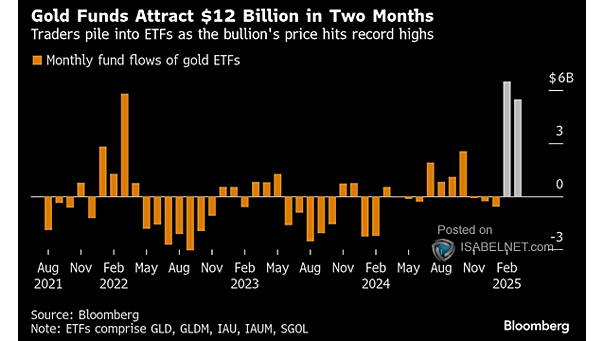
Total Known Gold ETFs Holdings Gold’s shine isn’t fading. ETF holdings just hit a three‑year high, and even with this week’s selloff, gold prices are still up over 50% this year. Image: Bloomberg
Total Known Gold ETFs Holdings Gold’s shine isn’t fading. ETF holdings just hit a three‑year high, and even with this week’s selloff, gold prices are still up over 50% this year. Image: Bloomberg
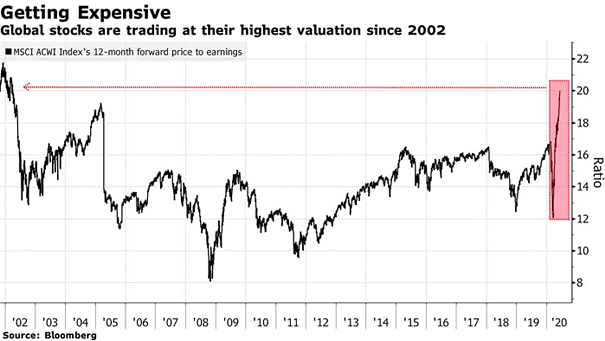
MSCI ACWI Index and Best Earnings-Per-Share With stocks priced for perfection and earnings forecasts at record highs, even a mild miss could put the market’s rally on the ropes. Image: Bloomberg
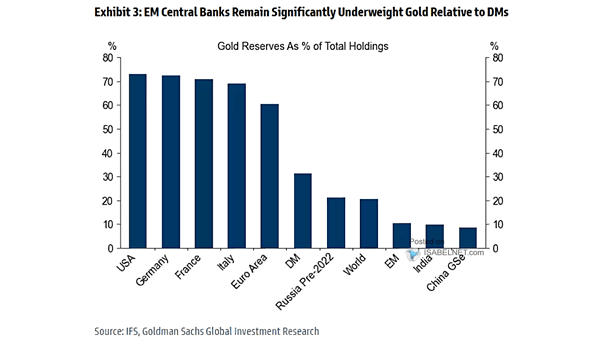
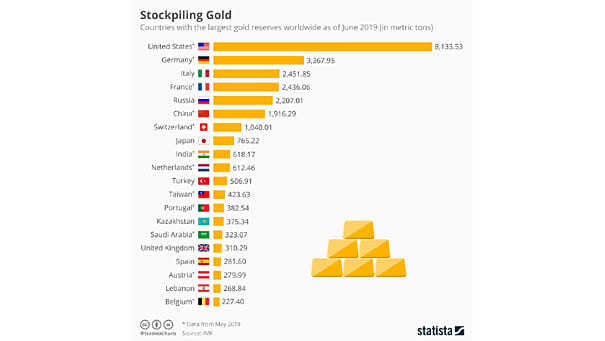
Global Central Bank Gold Reserves A striking 95% of reserve managers expect central banks to boost their gold holdings within 12 months, up from 81% a year ago—clear evidence of a sustained rush into the…
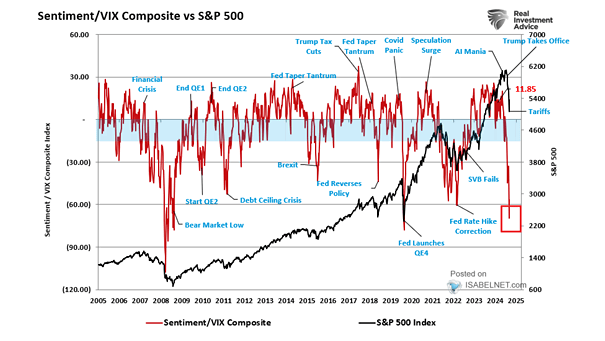
Sentiment/VIX Composite vs. S&P 500 Markets may be rallying, but the Sentiment/VIX Composite Index and broader positioning data show investors are still hedging their bets—more guarded than convinced about the rally’s staying power. Image: Real…
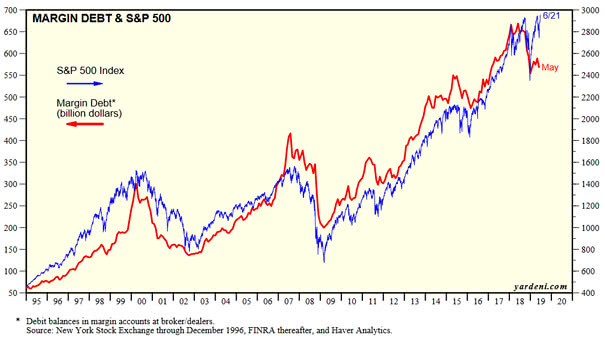
Margin Debt as % of U.S. Nominal GDP NYSE margin debt exceeding $1.1 trillion, near record highs relative to nominal GDP, signals rapid investor re-leveraging and heightened volatility risk, though not necessarily implying an imminent…
Gold Expanding Share of Global Foreign Exchange + Gold Reserve Holdings With gold now making up 30% of global foreign exchange and gold reserves, the metal is stealing back the spotlight—a clear sign of how…
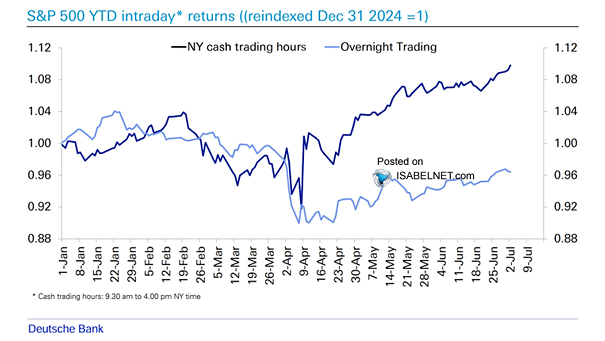
S&P 500 Intraday Returns – NY Cash Trading Hours vs. Overnight Trading U.S.-daytime volatility’s resurgence reflects renewed market focus on American macro developments, with global investors avoiding illiquid overnight hours—a behavior typically seen after major…
S&P 500 and Stoxx600 – Q3 2025 Reporting Season Calendar About 16% of S&P 500 firms report earnings this week, but the real test comes next week, with roughly 44% set to deliver results—a pivotal…
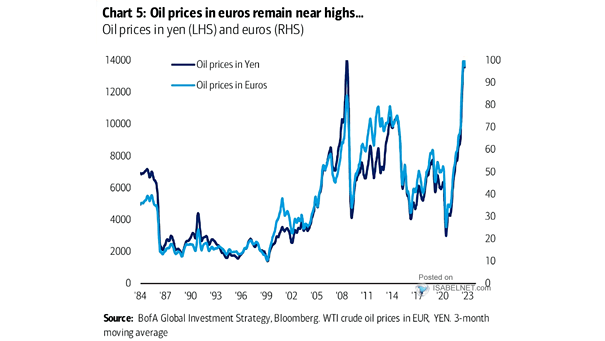
Oil Prices in Euros Oil’s recent slide, fueled by rising OPEC output, is deepening bearish sentiment across energy markets and cooling the inflation pulse that guides monetary policy. Image: Deutsche Bank
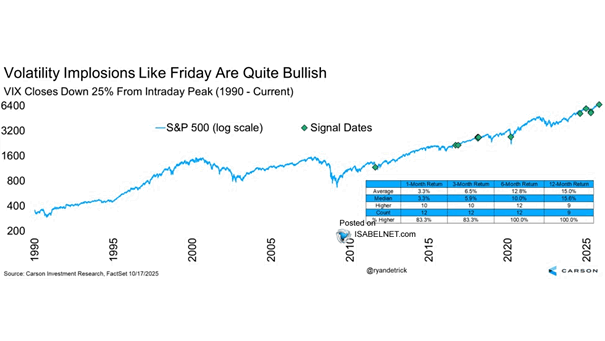
S&P 500 and VIX Closes Down 25% from Intraday Peak Good news for bulls: big fear fades, stocks surge. Each time the VIX finished more than 25% off its intraday high, the S&P 500 was…
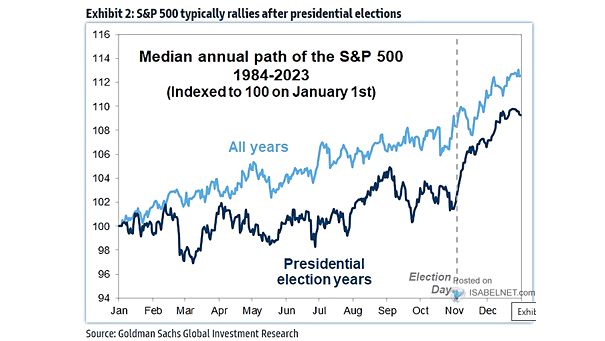
S&P 500 Seasonality If history is any guide, the S&P 500 is heading into its seasonally strong window, with October through December typically delivering the market’s best performance of the year. Image: Topdown Charts