
ISABELNET Cartoon of the Day
ISABELNET Cartoon of the Day After a roaring year for the S&P 500, bears are sick of 2025, fed up like cats on bath day, and now they’re charging after bulls as if it’s their…
ISABELNET Cartoon of the Day After a roaring year for the S&P 500, bears are sick of 2025, fed up like cats on bath day, and now they’re charging after bulls as if it’s their…
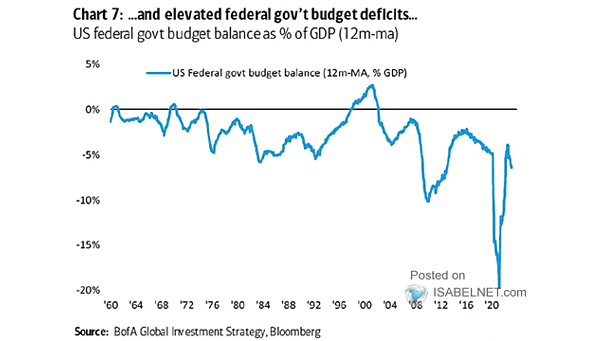
U.S. Budget Deficit as a % of GDP The U.S. administration’s strong interest in rate cuts is largely driven by the need to make financing the enormous deficit more sustainable. By lowering rates, the government…
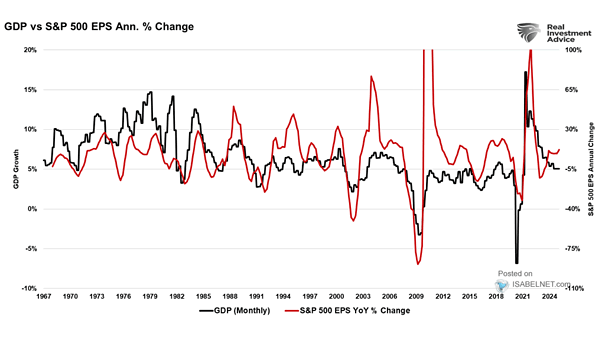
U.S. GDP vs. S&P 500 EPS With GDP growth and S&P 500 earnings moving in lockstep, vigilance is warranted. Valuations are lofty, forecasts are rosy, and history shows that when the economy cools, earnings don’t…
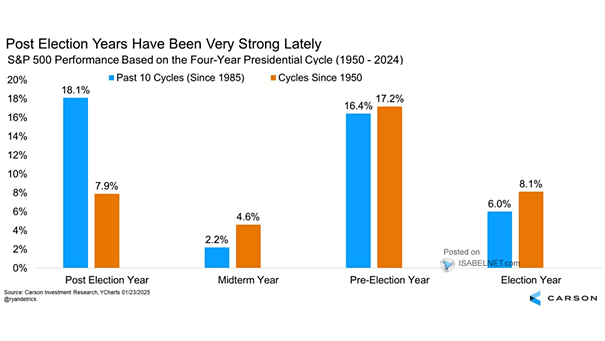
S&P 500 Index Returns Based on 4-Year Presidential Cycle Midterm election years rarely bring comfort to investors, but history still leans bullish. U.S. stocks tend to outperform in a President’s second term, as many view…
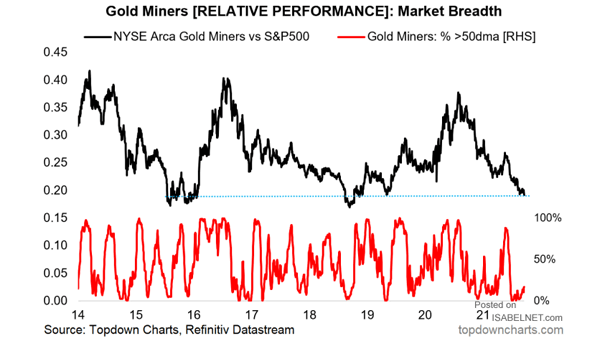
VanEck Gold Miners ETF (GDX) Gold has jumped beyond $4,000, but investors in the largest gold miners ETF are heading for the exits, wary of chasing the highs. Contrarians, meanwhile, smell opportunity. Image: Gavekal, Macrobond
Average Strategist Year-End S&P 500 Forecast Wall Street’s top strategists are unusually in sync, calling for the S&P 500 to extend its run in 2026 amid solid earnings, a supportive rate backdrop, and steady AI-fueled…
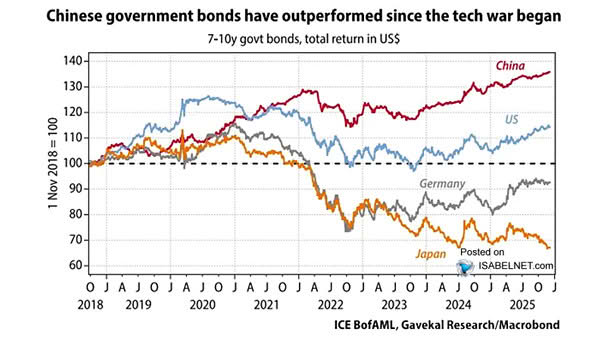
7-10 Year Government Bonds, Total Return in US$ Since the tech war began, Chinese government bonds have outperformed their U.S., German and Japanese counterparts, delivering higher total returns in recent years. Image: Gavekal, Macrobond
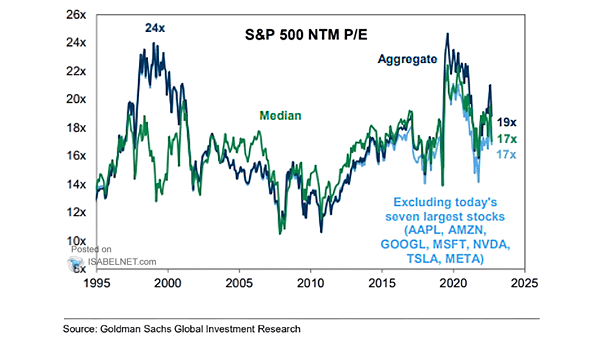
Valuation – S&P 500 Index – BEst P/E Ratio The S&P 500’s P/E stands one standard deviation above its five-year average, flashing a mild overvaluation warning. But markets can stay pricey for a while, so…
Three-Year Total Returns of MSCI World Sector Indexes Tech and Communication Services sectors have dominated global equity returns in recent years, lifted by a surge in AI-driven innovation across hardware, software, and digital infrastructure. Image:…
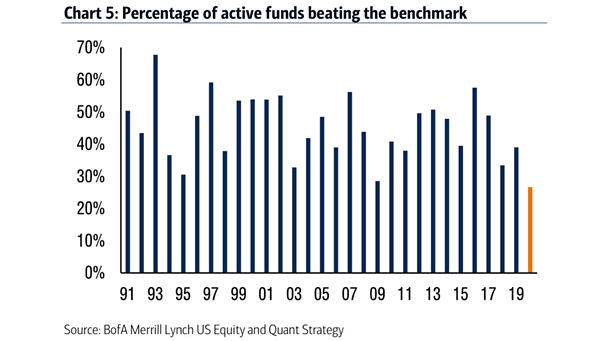
Percentage of U.S. Large-Cap Equity Mutual Funds Beating the S&P 500 In 2025, only a small minority of large‑cap active equity funds kept pace with the S&P 500. Managers who underweighted the “Magnificent Seven” were…
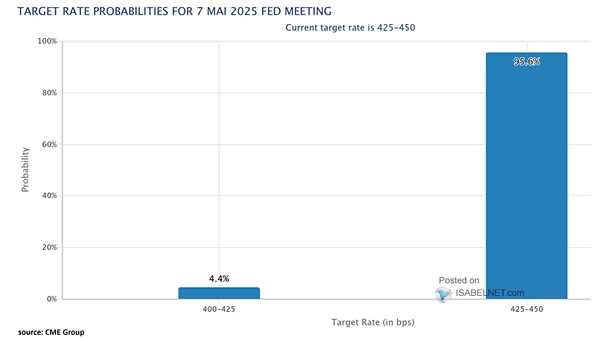
Fed Funds Rate – Target Probabilities at the Fed’s FOMC Meeting Traders aren’t betting heavily on a Fed rate cut at the January 28, 2026 FOMC meeting, with markets pricing in just an 18.8% chance…