Top 25 Members of the S&P 500
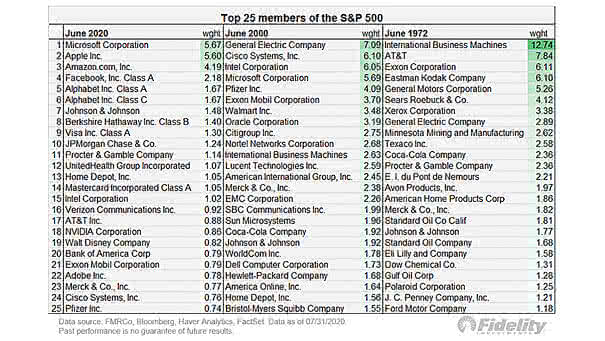
Top 25 Members of the S&P 500 Another tech bubble? This table shows the 25 largest stocks in 1973, 2000 and 2020. Back in 1973, IBM was 12.74% of the market capitalization. Image: Fidelity Investments
Top 25 Members of the S&P 500 Another tech bubble? This table shows the 25 largest stocks in 1973, 2000 and 2020. Back in 1973, IBM was 12.74% of the market capitalization. Image: Fidelity Investments
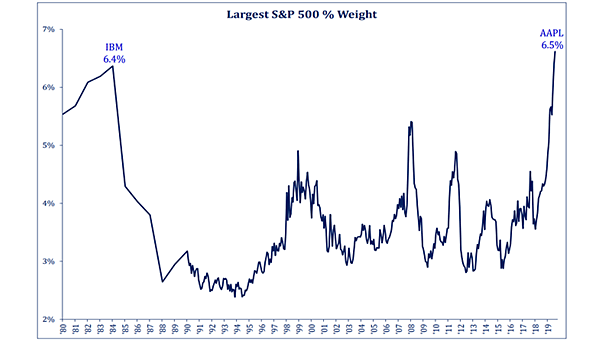
Apple Market Capitalization in the S&P 500 Apple is now the largest weight by market capitalization in the S&P 500 over the last 40-years. Image: Strategas Research Partners
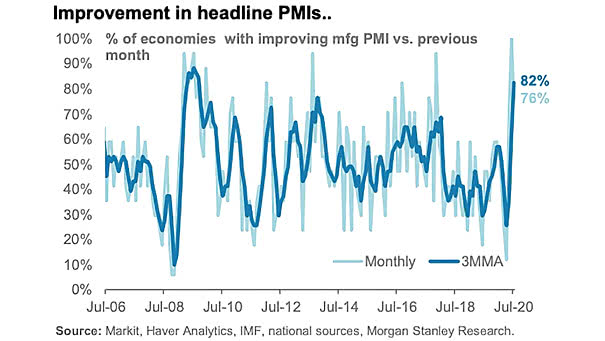
% of Economies with Improving Manufacturing PMI vs. Previous Month Based on a 3-month moving average, 82% of economies now see an improvement in their manufacturing sector compared to the previous month. Image: Morgan Stanley…
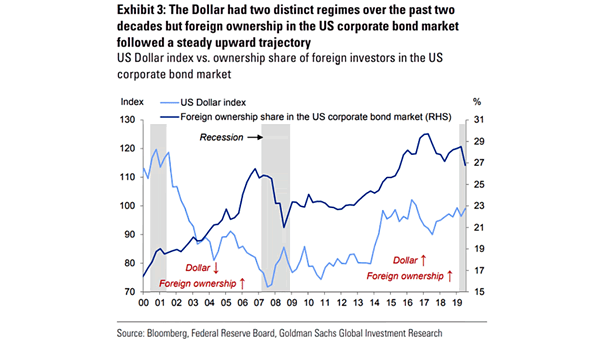
U.S. Dollar Index and Foreign Ownership Share in the U.S. Corporate Bond Market Chart suggesting that the relationship is virtually non-existent between the U.S. dollar and net foreign purchases of U.S. corporate bonds. Image: Goldman…
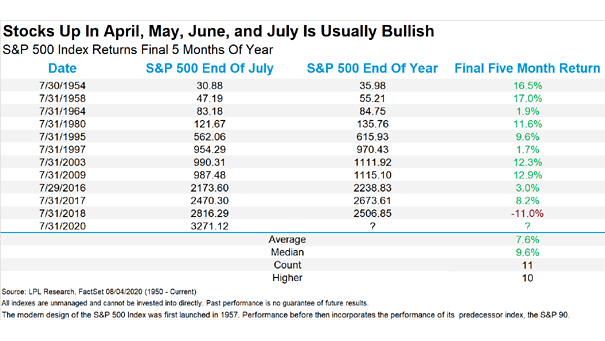
S&P 500 Index Returns Final 5 Months of Year When the S&P 500 is up in April, May, June, and July, as it is this year, it tends to be bullish. Image: LPL Research
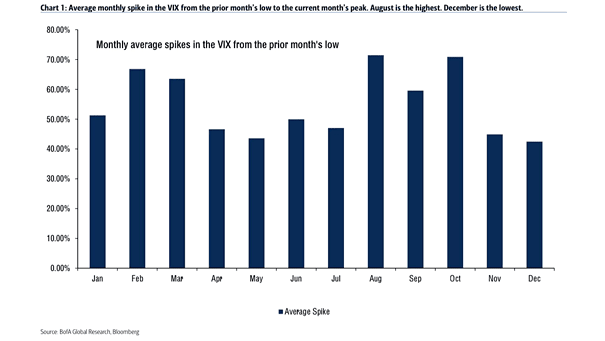
Seasonality of Monthly Spikes in the VIX Historically, there are higher than average VIX spikes in August, September and October. Image: BofA Global Research
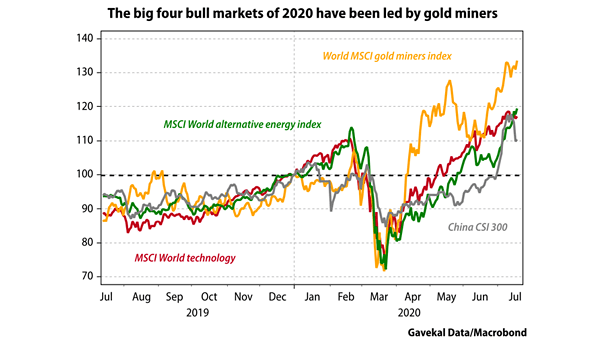
Bull Markets of 2020 Is the gold rally sustainable? Precious metal miners have outperformed all other asset classes since the beginning of the year. Image: Gavekal, Macrobond
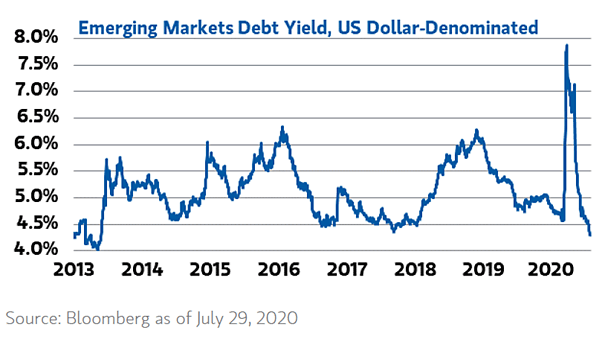
Emerging Markets Debt Yield The cost of servicing emerging markets debt denominated in U.S. dollars has fallen to almost 4%, thanks to global central bank liquidity and the weakening of the U.S. dollar. Image: Morgan…
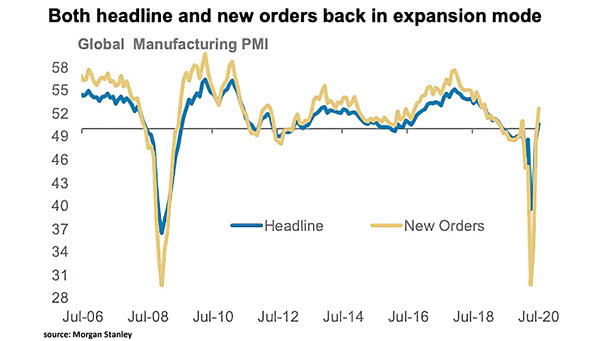
Global Manufacturing PMI in July Global Manufacturing PMIs are back above 50 in July, suggesting a V-shaped recovery in global economy. Image: Morgan Stanley Research
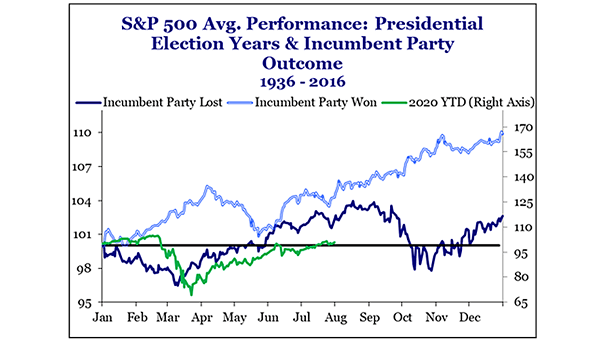
S&P 500 Average Performance – Presidential Election Years & Incumbent Party Outcome 1936-2016 The S&P 500 has been a great indicator in the three months prior to the U.S. presidential election. Historically, the S&P 500’s…
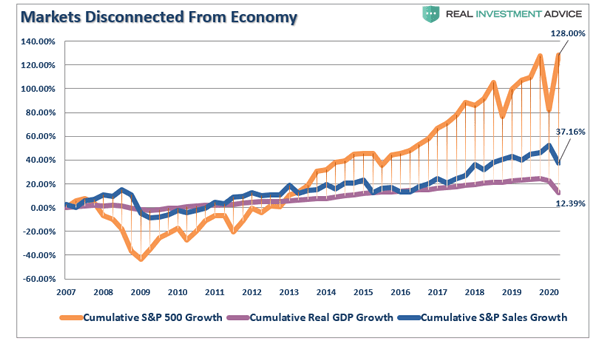
S&P 500 Growth vs. U.S. Real GDP Growth vs. S&P 500 Sales Growth Do valuations still matter? This chart puts into perspective the wide divergence between the S&P 500 and the U.S. economy. Image: Real…