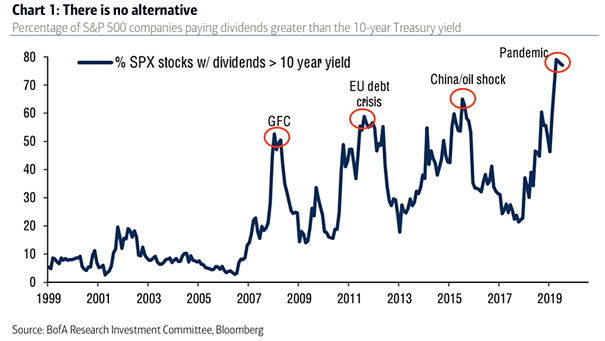
Global Growth and Macro Data
Global Growth and Macro Data Macro data are turning sharply positive. Is the recovery faster than expected? Image: Goldman Sachs Global Investment Research
U.S. Elections and S&P 500 Average 3-Month Forward Return from August 1st During Election Years The S&P 500 tends to see worse-than-average performance leading up to U.S. elections. Image: Morgan Stanley Research
Global Breadth – MSCI ACWI and Global Advance-Decline Line of 73 Country Indices The chart suggests a bullish trend for the weekly global index level breadth. Image: BofA Global Research
Coronavirus vs. Spanish Flu The Spanish flu hit the world in three waves. Is a second or a third wave of the coronavirus pandemic likely? Image: BCA Research
U.S. Macro Fundamentals vs. S&P 500 This chart shows the current wide divergence between U.S. lead indicators and the S&P 500 (R² = 0.97). Image: Pictet Asset Management
Coronavirus Hit to the Level of U.S. Real GDP Goldman Sachs now forecasts U.S. GDP growth of -4.2% in 2020 and +5.8% in 2021 (baseline scenario). Image: Goldman Sachs Global Investment Research
Interest Rates – Market-Implied Probability of Negative Policy Rate 1 Year Ahead Negative interest rates in the US and the UK ahead? Option markets point to elevated probabilities. Image: Goldman Sachs Global Investment Research
Eurozone Real M1 Money Supply Growth vs. Real GDP Growth This chart suggests the relationship between real M1 growth and euro area GDP growth. Image: Longview Economics
Level of U.S. Real GDP Forecast Goldman Sachs forecasts a more front-loaded recovery in the United States. Image: Goldman Sachs Global Investment Research
Fed’s Broad U.S. Dollar and Rest of the World Minus US GDP Growth This chart suggests that the U.S. dollar tends to weaken when RoW growth outperforms that in the United States. Image: Morgan Stanley…
10/2 Treasury Yield Curve vs. 12-Month Forward EPS (Leading Indicator) Chart suggesting that the 10/2 Treasury yield curve tends to lead 12-month forward EPS by 22 months. Image: Alpine Macro