
U.S. Housing – MBA Purchase Applications Index
U.S. Housing – MBA Purchase Applications Index Demand for housing has formed a V-shape in recent months. Image: Goldman Sachs Global Investment Research
U.S. Housing – MBA Purchase Applications Index Demand for housing has formed a V-shape in recent months. Image: Goldman Sachs Global Investment Research
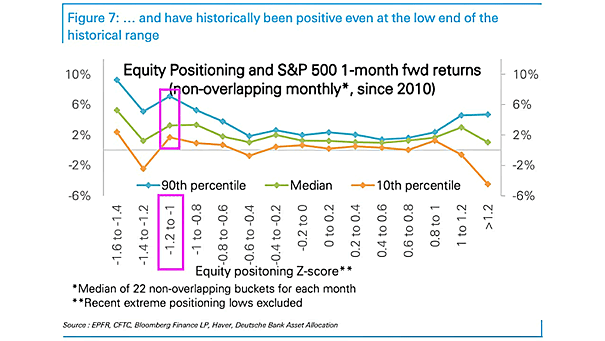
Equity Positioning and S&P 500 1-Month Forward Returns Equity positioning at -1.2 standard deviations suggests positive S&P 500 1-month forward returns on average. Image: Deutsche Bank Asset Allocation
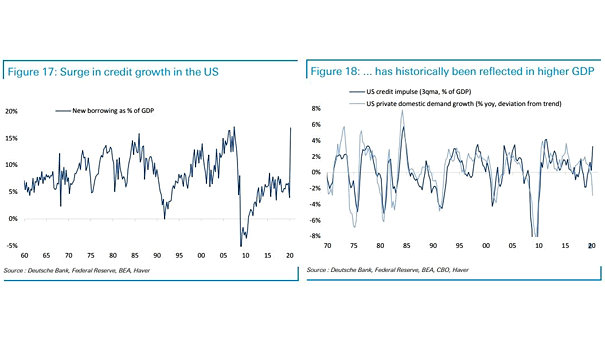
U.S. Credit Impulse as % of GDP vs. U.S. Private Domestic Demand Growth Credit growth in the U.S. has historically been a good indicator of underlying GDP growth. Image: Deutsche Bank
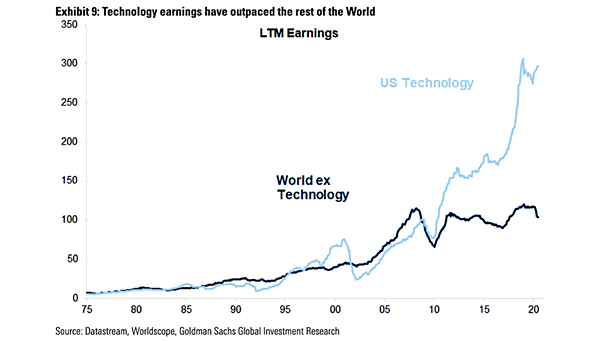
LTM Earnings – World Ex Technology vs. U.S. Technology Technology earnings have outpaced significantly the rest of the world. Image: Goldman Sachs Global Investment Research
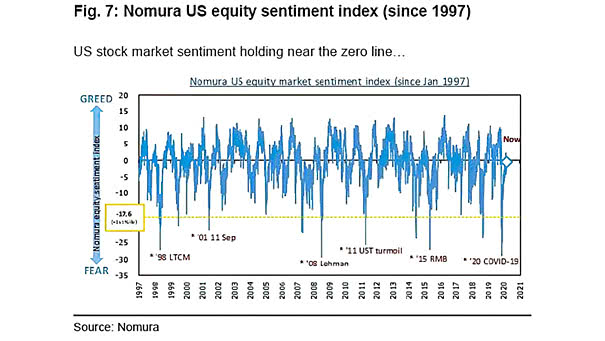
U.S. Equity Sentiment Index Since 1997 The U.S. stock market sentiment is holding zero. Image: Nomura
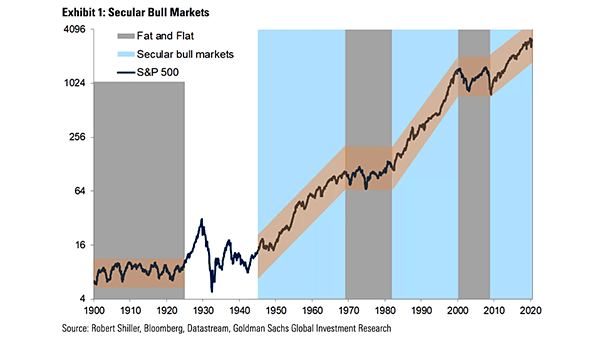
Secular Bull Markets Chart suggesting that the S&P 500 will likely be trapped in a “fat and flat” range in the coming era. Image: Goldman Sachs Global Investment Research
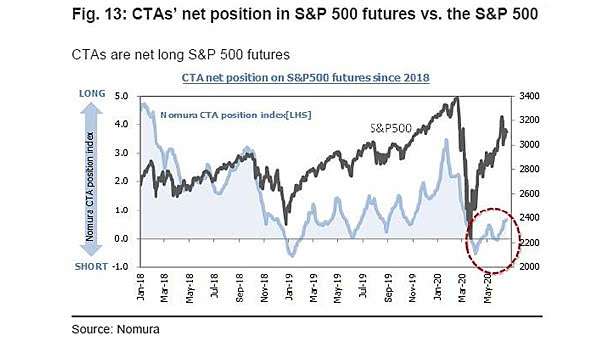
CTA’s Net Position in S&P 500 Futures vs. the S&P 500 This chart suggests that CTAs could continue their net buying of S&P 500 futures. Image: Nomura
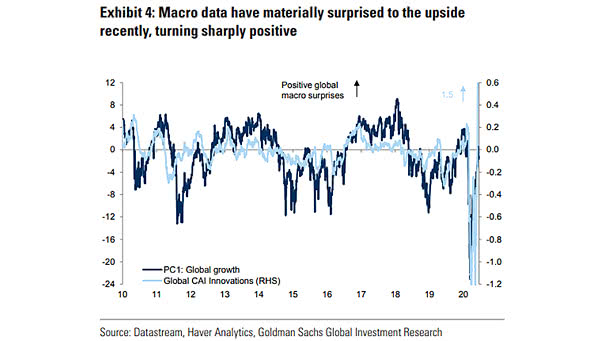
Global Growth and Macro Data Macro data are turning sharply positive. Is the recovery faster than expected? Image: Goldman Sachs Global Investment Research
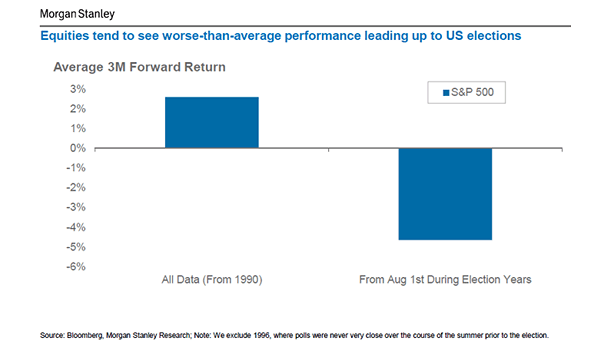
U.S. Elections and S&P 500 Average 3-Month Forward Return from August 1st During Election Years The S&P 500 tends to see worse-than-average performance leading up to U.S. elections. Image: Morgan Stanley Research
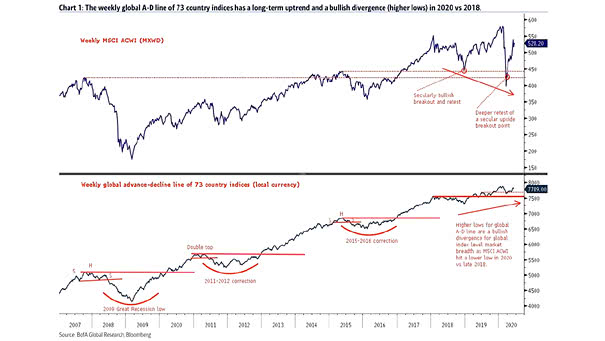
Global Breadth – MSCI ACWI and Global Advance-Decline Line of 73 Country Indices The chart suggests a bullish trend for the weekly global index level breadth. Image: BofA Global Research
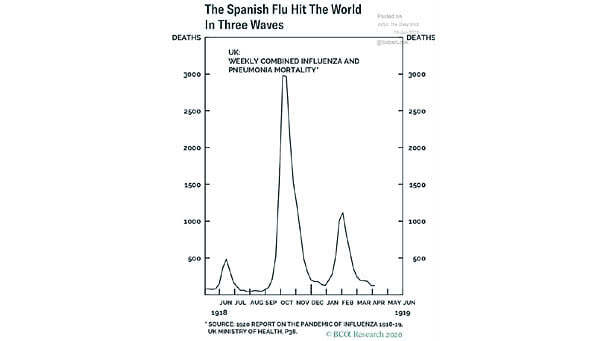
Coronavirus vs. Spanish Flu The Spanish flu hit the world in three waves. Is a second or a third wave of the coronavirus pandemic likely? Image: BCA Research