Coronavirus – Early Openers and Virus Incidence
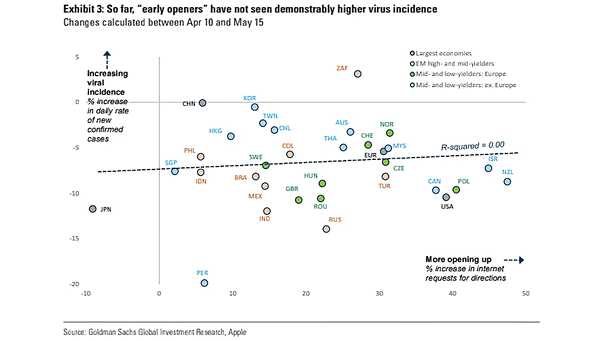
Coronavirus – Early Openers and Virus Incidence On the positive side, the first countries that eased lockdown measures have not seen higher virus incidence. Image: Goldman Sachs Global Investment Research