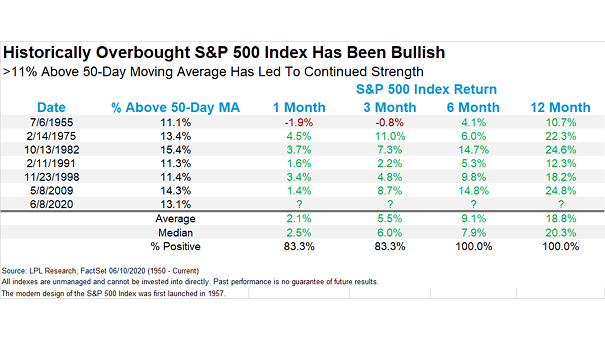
S&P 500 and >11% Above 50-Day Moving Average
S&P 500 and >11% Above 50-Day Moving Average Short-term overbought, but historically, >11% above 50-day moving average has been bullish. Image: LPL Research
S&P 500 and >11% Above 50-Day Moving Average Short-term overbought, but historically, >11% above 50-day moving average has been bullish. Image: LPL Research
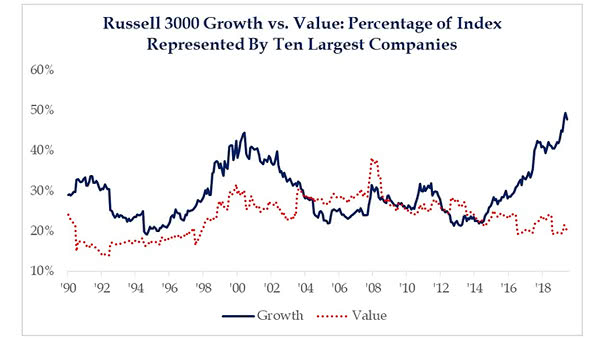
Russell 3000 Growth vs. Value – Percentage of Index Represented by Ten Largest Companies The gap between the Russell 3000 Growth Index and the Russell 3000 Value Index (% of ten largest companies) is widening.…
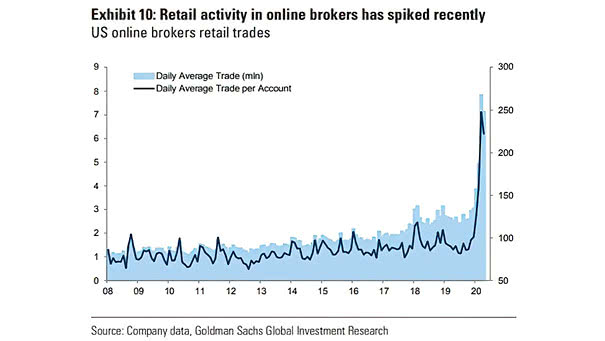
Individual Investors and U.S. Online Brokers Retail Trades The lockdowns and the move to zero commissions in October boosted individual investor trades. Image: Goldman Sachs Global Investment Research
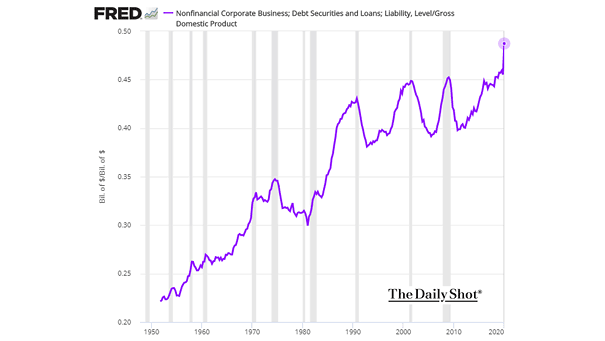
U.S. Corporate Debt Is U.S. corporate debt in serious trouble, approaching 50% of GDP? Image: The Daily Shot
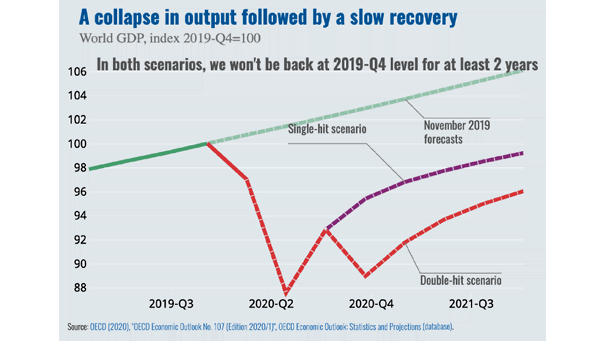
World GDP – OECD Global Economic Outlook According to the OECD, the coronavirus crisis means no V-shaped recovery, as the consequences will be severe and long-lasting. Image: Organisation for Economic Co-operation & Development
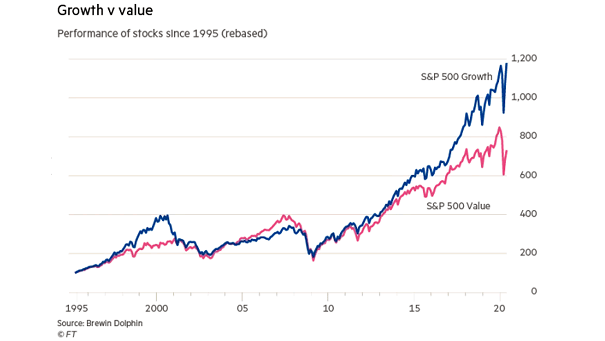
S&P 500 Growth vs. S&P 500 Value Since 1995 Growth has outperformed value by a large margin since the GFC. As long as growth is scarce, growth companies should thrive. Image: Financial Times
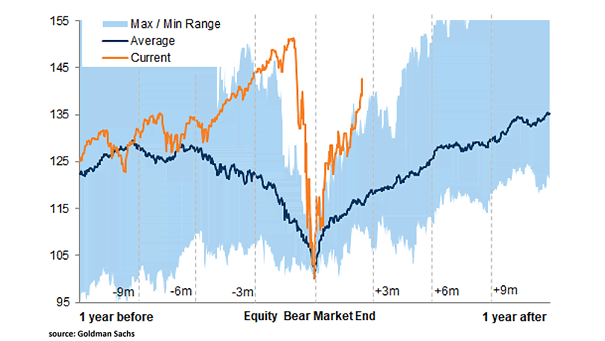
S&P 500 Performance Around Equity Bear Market End (Data Since 1983) The rally since March low has been the strongest equity recovery since 1983. Image: Goldman Sachs Global Investment Research
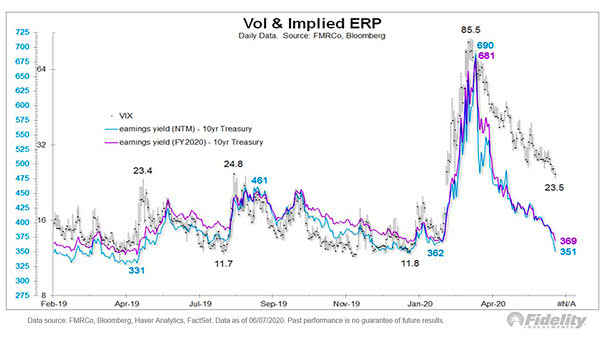
VIX (Volatility) and Implied Equity Risk Premium The risk of a correction is rising, as the implied equity risk premium is now below what the VIX would suggest. Image: Fidelity Investments
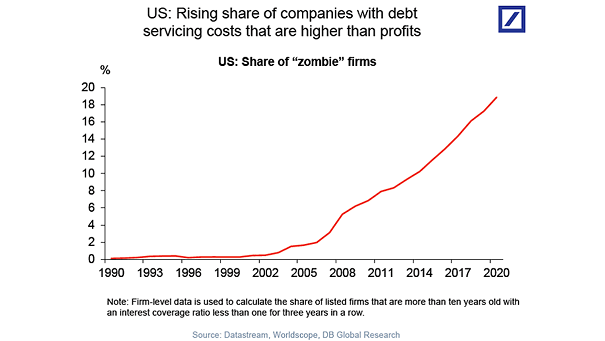
Share of U.S. Zombie Companies The cost of extended monetary easing: low interest rates have created zombie firms. Image: Deutsche Bank Global Research
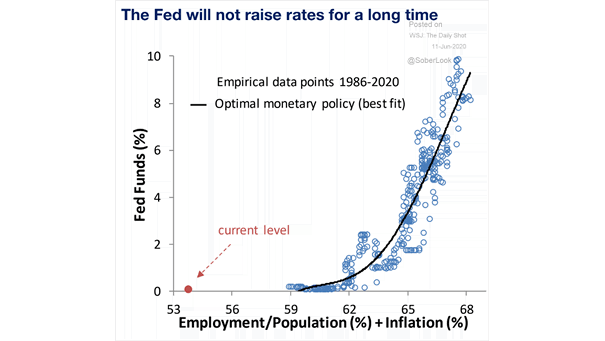
Fed Funds vs. Employment/Population + Inflation This chart suggests the optimal monetary policy, while Fed officials do not anticipate any rate hikes until 2022. Image: Oxford Economics
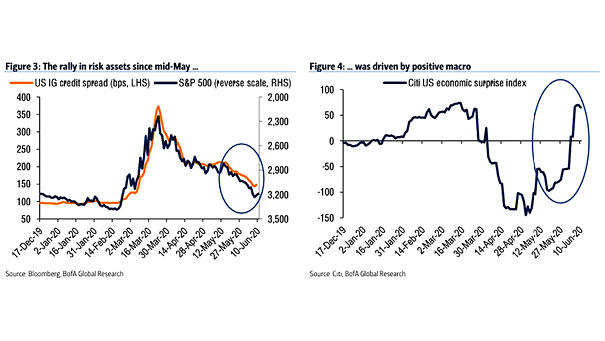
U.S. IG Credit Spread and S&P 500 vs. Citi U.S. Economic Surprise Index Chart suggesting that since mid-May, the rally has been driven by positive macroeconomic factors. Image: BofA Global Research