Valuation and U.S. 10-Year Treasury Yield
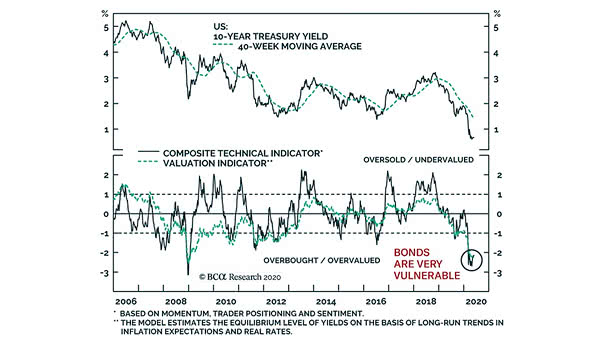
Valuation and U.S. 10-Year Treasury Yield Are bonds risky? This chart suggests that U.S. Treasury bonds are very vulnerable to downside risks. Image: BCA Research
Valuation and U.S. 10-Year Treasury Yield Are bonds risky? This chart suggests that U.S. Treasury bonds are very vulnerable to downside risks. Image: BCA Research
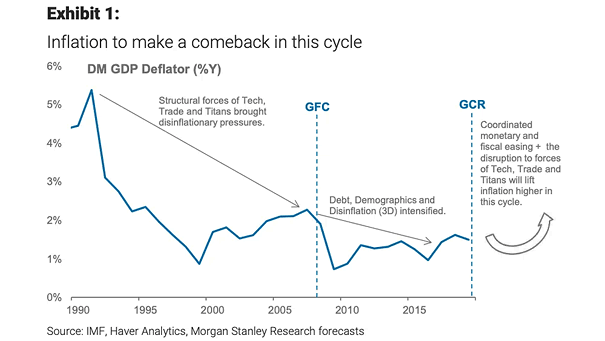
Inflation in this Cycle (DM GDP Deflator) Morgan Stanley expects the return of inflation after the Great COVID-19 Recession (GCR). Image: Morgan Stanley Research
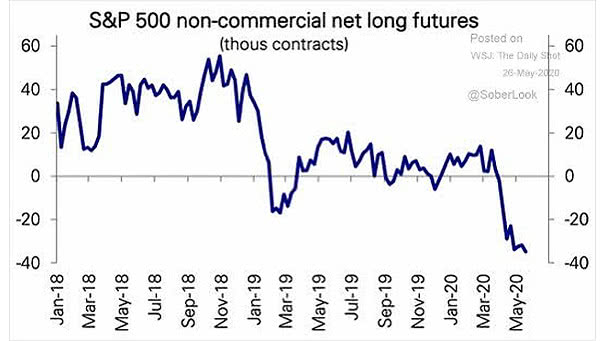
S&P 500 Non-Commercial Net Long Futures Speculative futures in S&P 500 are net short. Image: Deutsche Bank
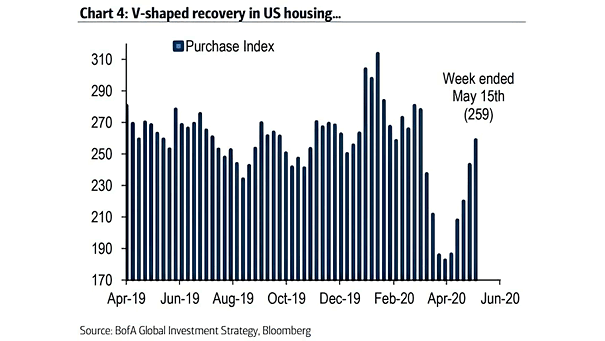
U.S. Housing Market This chart suggests that the U.S. housing market has already started to recover. Image: BofA Global Investment Strategy
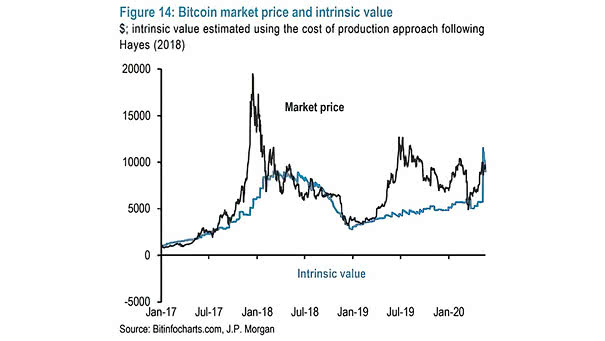
Bitcoin Market Price and Intrinsic Value This chart suggests Bitcoin’s intrinsic value using the cost of production approach following Hayes. Image: J.P. Morgan
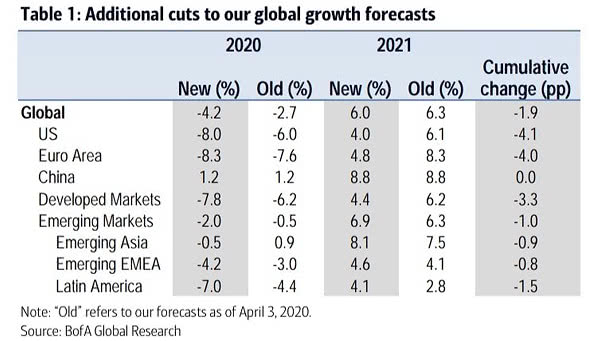
Global GDP Growth Forecasts BofA has revised lower 2020 GDP growth for 28 of 43 countries. Image: BofA Global Research
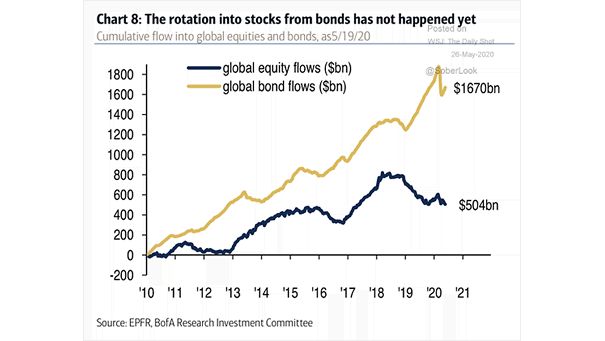
Cumulative Flow into Global Equities and Bonds So far, there is no sign of a great rotation into stocks from bonds. Image: BofA Research Investment Committee
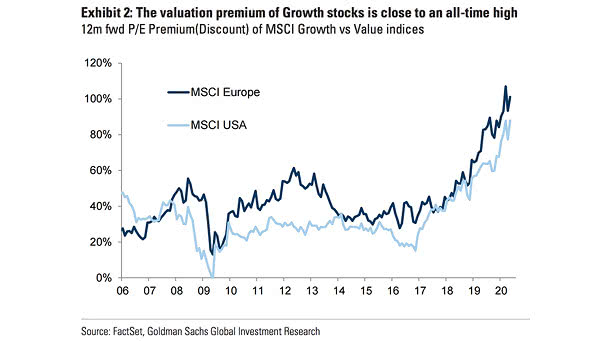
Valuation – P/E Premium of MSCI Growth vs. Value Indices The valuation premium of growth stocks vs. value stocks is close to an all-time high. Image: Goldman Sachs Global Investment Research
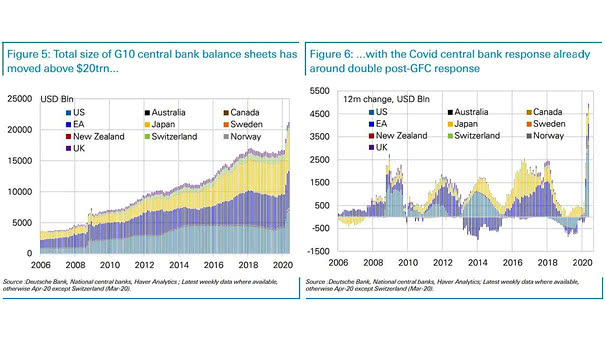
G10 Central Bank Balance Sheets The total size of G10 central bank balance sheets has now surpassed $20 trillion. Image: Deutsche Bank
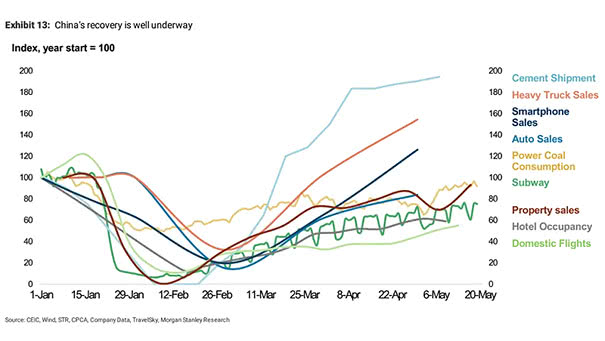
China Recovery China recovery is well underway, suggesting a quick economic recovery. Image: Morgan Stanley Research
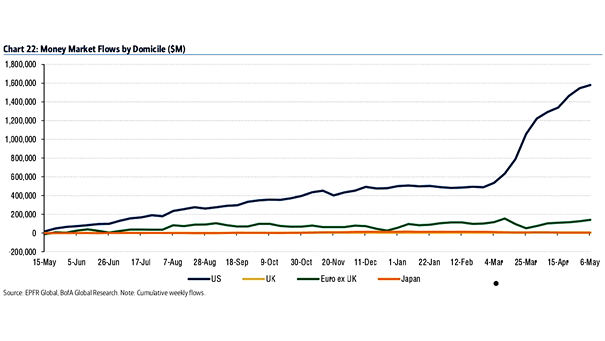
Cumulative Weekly Money Market Flows by Domicile Record money market flows in the United States, as the coronavirus pandemic leads to a flight to quality. Image: BofA Global Research