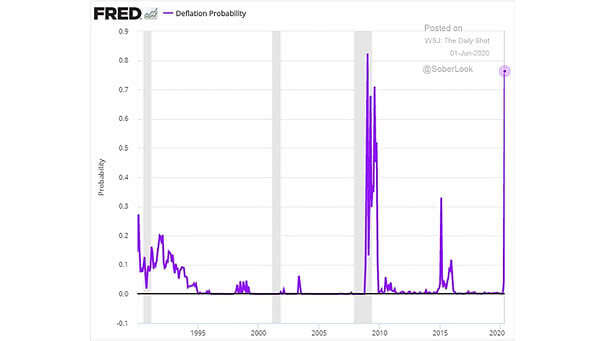
Fed Deflation Probability (Inflation Below Zero)
Fed Deflation Probability (Inflation Below Zero) This chart suggests the high probability that the U.S. inflation rate will fall below zero over the next 12 months.
Fed Deflation Probability (Inflation Below Zero) This chart suggests the high probability that the U.S. inflation rate will fall below zero over the next 12 months.
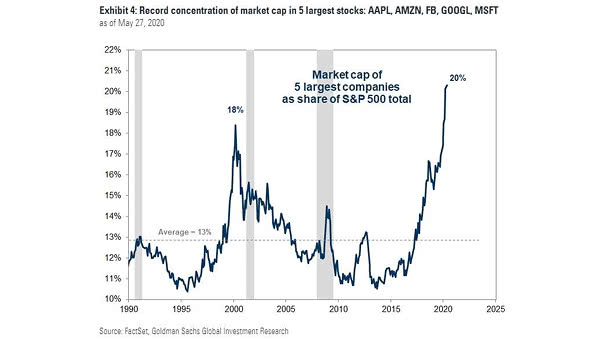
Market Capitalization of 5 Largest Companies as Share of S&P 500 Total The market capitalization of the five largest companies now accounts for 20% of S&P 500 total, while the average is 13%. Image: Goldman…
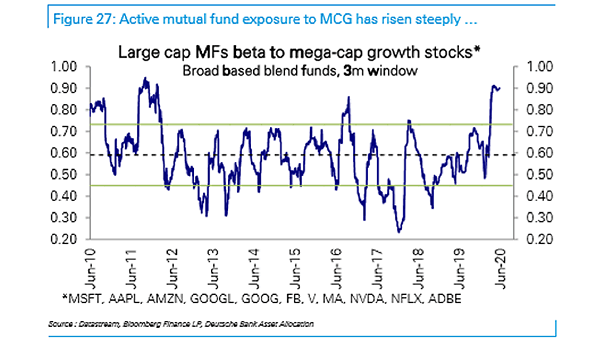
Large-Cap Mutual Funds Beta to Mega-Cap Growth Stocks Mega-cap growth stocks have seen their exposure in mutual funds rising steeply. Image: Deutsche Bank Asset Allocation
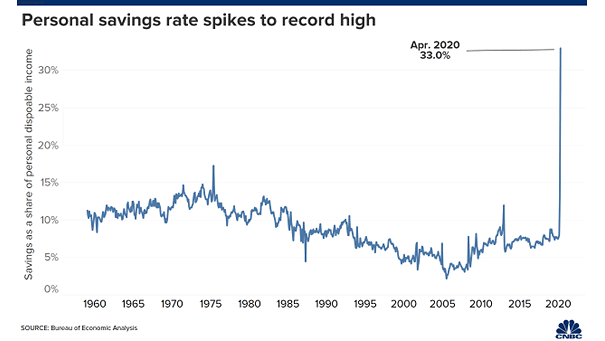
U.S. Personal Saving Rate The personal savings rate soared to 33% in April, as coronavirus causing Americans to accumulate cash. Image: CNBC
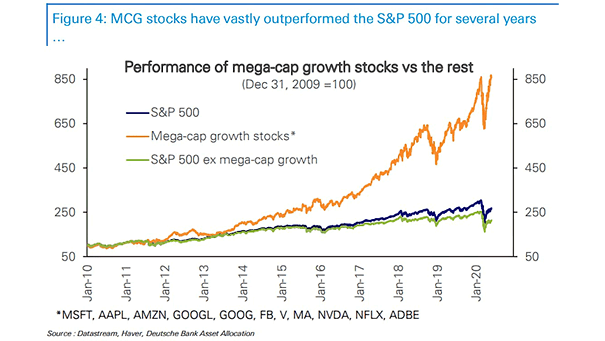
Performance of Mega-Cap Growth Stocks vs. the Rest This chart highlights the outperformance of mega-cap growth stocks vs. the rest since several years. Deutsche Bank Asset Allocation
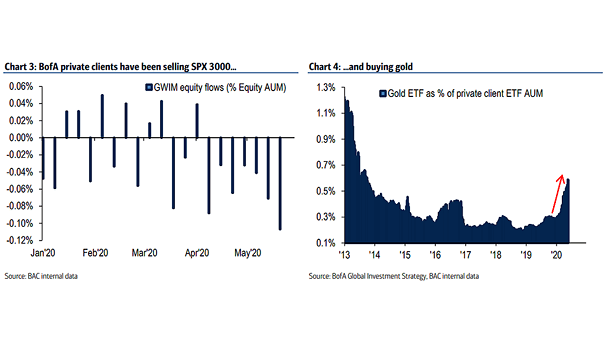
S&P 500 and Gold – GWIM Equity Flows and Gold ETF Demand for gold remains strong. BofA private clients have been selling S&P 500 at 3000 and buying gold. Image: BofA Global Investment Strategy
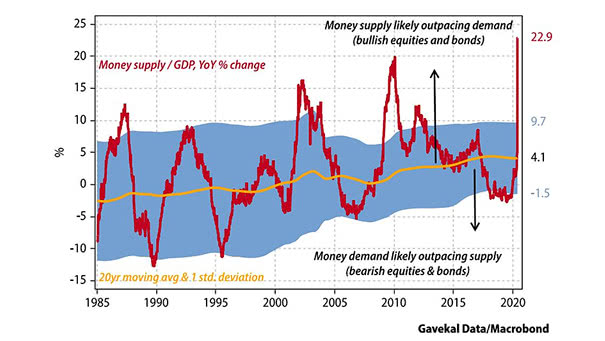
Money Supply to GDP vs. Equities and Bonds Historically, when money supply exceeds nominal GDP growth, it tends to be bullish for stocks and bonds. Image: Gavekal, Macrobond
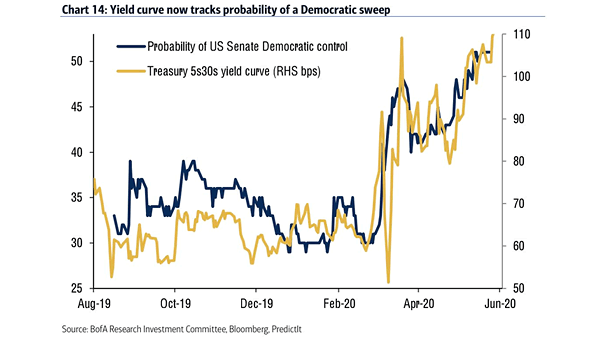
U.S. Treasury 30Y-5Y Yield Curve and Probability of U.S. Senate Democratic Control A Democratic sweep is a possibility, as the yield curve now tracks the likelihood of Democratic control of the U.S. Senate. Image: BofA…
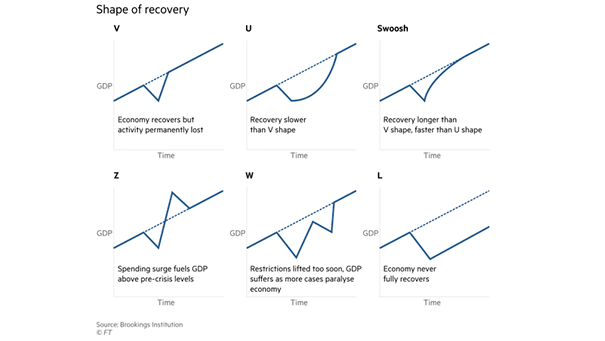
GDP and Shape of Recovery V-shaped or Swoosh? This chart shows the alphabet of economic recovery scenarios. Image: Financial Times
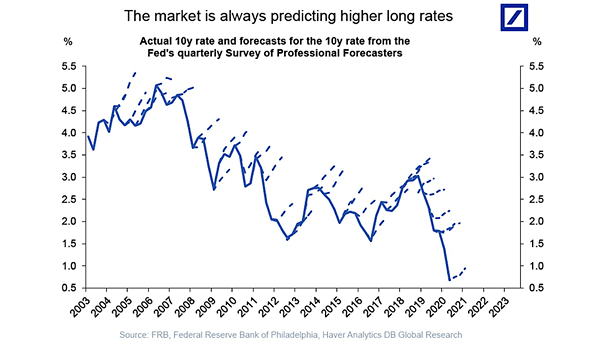
Actual 10-Year Rate vs. Forecasts for the 10-Year Rate This chart highlights that the market has been wrong predicting higher long rates. Image: Deutsche Bank Global Research
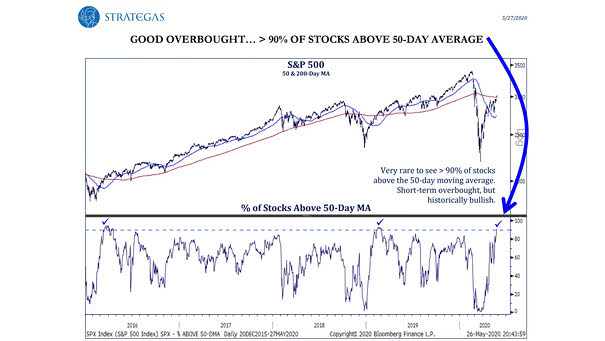
More than 90% of Stocks above 50-Day Moving Average Short-term overbought, but historically, more than 90% of stocks above the 50-day moving average is bullish. Image: Strategas Research Partners