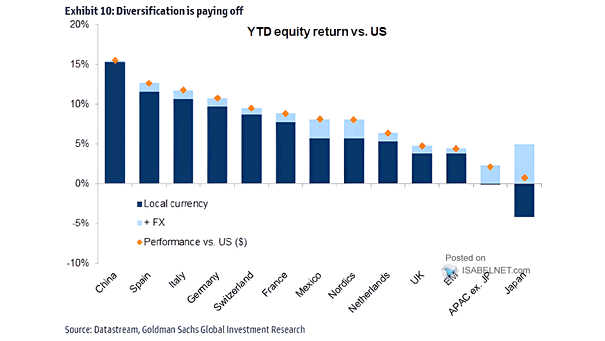
U.S. Job Openings and S&P 500

U.S. Job Openings and S&P 500 Job openings generally reflect current economic conditions, while the stock market reflects investors’ future expectations. Image: BofA Global Investment Strategy

S&P 500 Performance the Year After a Negative Midterm Year

S&P 500 Performance the Year After a Negative Midterm Year Since 1950, U.S. stocks have consistently gained in a pre-election year and election year following a negative midterm year, giving investors reason to be optimistic…

Weekly Equity Fund Flows

Weekly Equity Fund Flows Equity funds seeing $82 billion inflows over the past 10 weeks indicates the strong confidence investors have in the potential returns in equity markets. Image: BofA Global Investment Strategy

U.S. 10Y-3M Yield Curve and Recessions

U.S. 10Y-3M Yield Curve and Recessions The U.S. 10Y-3M Treasury yield curve has been a reliable recession risk indicator, but every economic situation is unique and historical patterns may not repeat exactly. Image: BofA Global…

S&P 500 Performance After 9-Week Win Streaks

S&P 500 Performance After 9-Week Win Streaks Historically, 9-week win streaks tend to be bullish for U.S. stocks, with a median 12.4% increase in value seen a year later since 1950, giving investors good reason…

S&P 500 Valuations

S&P 500 Valuations While high valuations can persist, investors should be aware of the potential for lower future returns when valuations remain elevated for an extended period. Image: Topdown Charts

Performance – U.S. vs. Global ex-U.S.

Performance – U.S. vs. Global ex-U.S. Given U.S. equities near extreme peaks compared to global stocks, should long-term investors consider reallocating more of their portfolio to global ex-U.S. stocks instead of heavily investing in U.S.…

Investor Psychology Cycle

Investor Psychology Cycle When investor psychology is overly negative, it may indicate undervalued market prices, presenting buying opportunities for investors who are able to take a contrarian approach and invest when others are fearful. Image:…

January Barometer – S&P 500 Index Returns

January Barometer – S&P 500 Index Returns Historically, the average annual return of the S&P 500 index tends to experience a substantial decrease during periods when stocks encounter challenges in the month of January. Image:…