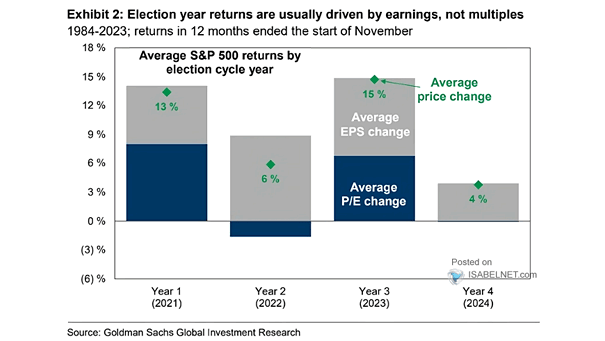
Average S&P 500 Returns by Election Cycle Year

Average S&P 500 Returns by Election Cycle Year The dynamics and uncertainties of the electoral process often impact market performance in presidential election years, leading to a historical trend of weaker S&P 500 returns. Image:…
Percent of 10 Yield Curves Inverted

Percent of 10 Yield Curves Inverted Historically, inverted yield curves have often signaled upcoming U.S. recessions, making them an important indicator that economists and analysts closely monitor to assess the condition of the economy. Image:…

Fed Funds vs. 2-Year U.S. Treasury Yield (Leading Indicator)

Fed Funds vs. 2-Year U.S. Treasury Yield (Leading Indicator) The 2-year U.S. Treasury yield below the fed funds rate indicates that the Fed’s monetary policy is currently restrictive, which could potentially lead to a slowdown…

Total Return Performance Since First Fed Hike in March 2022

Total Return Performance Since First Fed Hike in March 2022 There has been a significant concentration of equity market returns following the first Fed hike in March 2022. This concentration should be considered by investors…

Components of S&P 500 Total Return

Components of S&P 500 Total Return Given that S&P 500 returns in 2023 were driven more by valuations than earnings, should investors anticipate a reversal of this trend in 2024, where earnings become a more…