Growth in New Coronavirus Cases and VIX (Volatility)
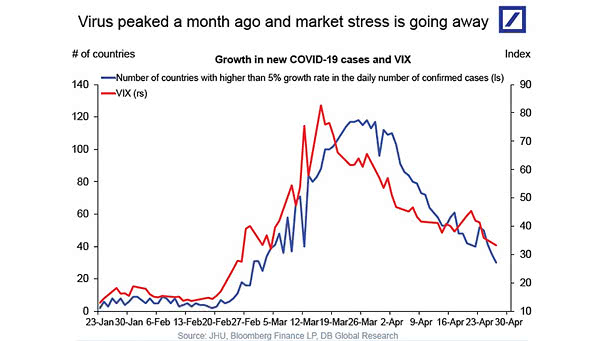
Growth in New Coronavirus Cases and VIX (Volatility) As the coronavirus pandemic subsides, volatility is going away. Image: Deutsche Bank Global Research
Growth in New Coronavirus Cases and VIX (Volatility) As the coronavirus pandemic subsides, volatility is going away. Image: Deutsche Bank Global Research
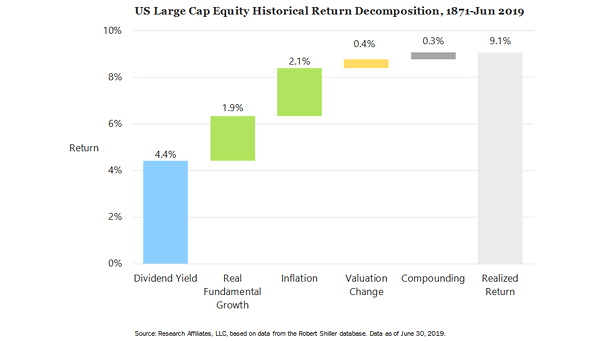
U.S. Large Cap Equity Historical Return Decomposition This chart shows the sources of historical returns since 1871. Image: Research Affiliates, LLC
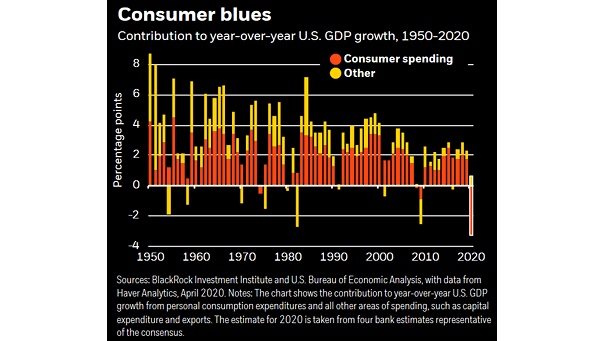
U.S. Consumer Spending Contribution to YoY U.S. GDP Growth This time will be different, as U.S. consumer spending rarely falls into negative territory even during recessions. Image: BlackRock Investment Institute
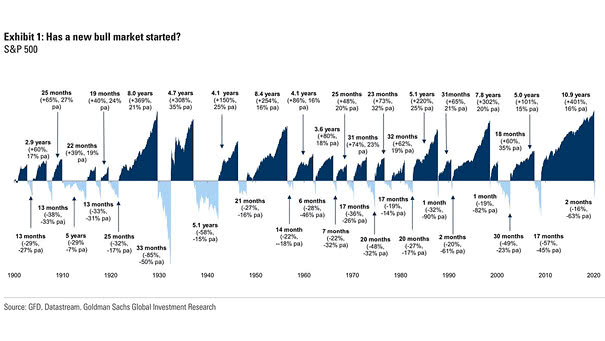
S&P 500 and Bull Markets Goldman Sachs asks: “Has a new bull market started?” Image: Goldman Sachs Global Investment Research
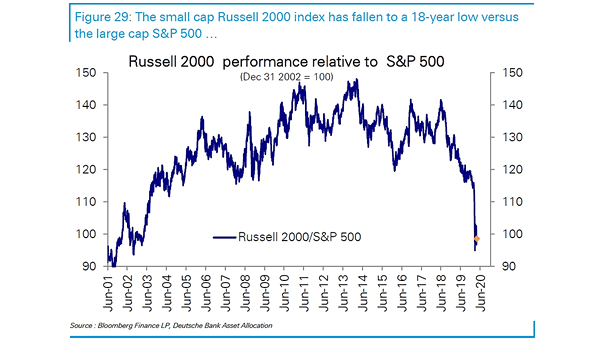
Small Caps – Russell 2000 Performance Relative to S&P 500 The small cap Russell 2000 index relative to the S&P 500 is at 18-year low. Image: Deutsche Bank Asset Allocation
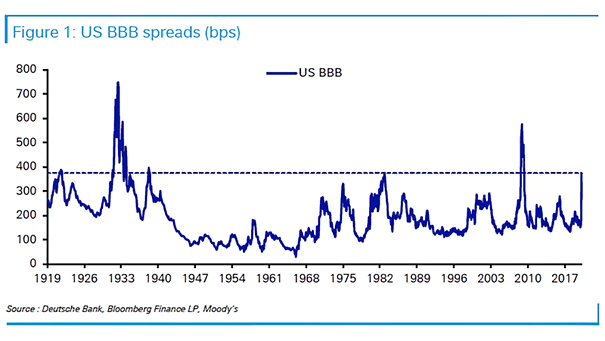
Credit Risk – U.S. BBB Spreads Outside of GFC and the Great Depression, U.S. BBB spreads have never been higher. Image: Deutsche Bank
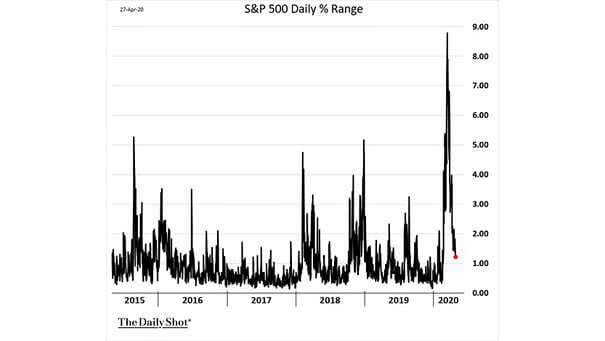
Volatility – S&P 500 Daily % Range A lower volatility suggests a higher probability of a rising stock market. Image: The Daily Shot
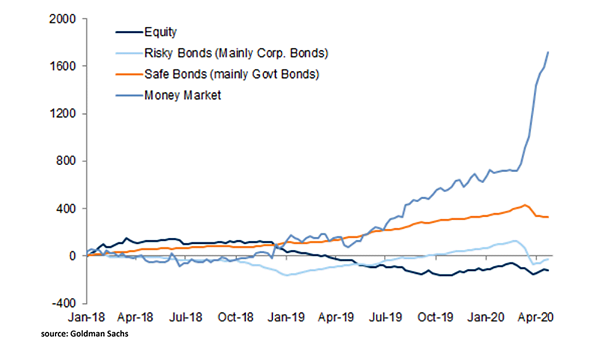
Fund Flows – Equity, Bonds and Money Market Funds Investors frightened by the coronavirus pandemic, put a record amount of cash into money market funds. Image: Goldman Sachs Global Investment Research
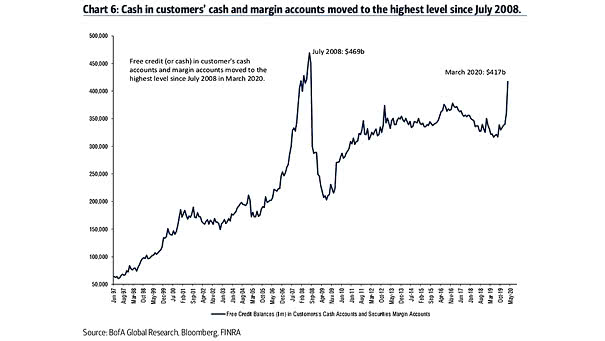
Free Credit Balances in Customers’s Cash Accounts and Securities Margin Accounts Cash levels in customers cash and margin accounts surged to the highest level since July 2008. Image: BofA Global Research
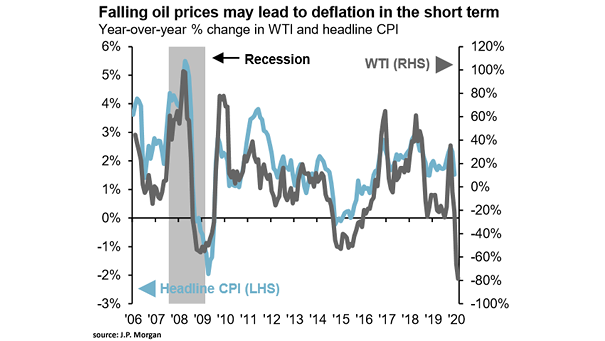
WTI Crude Oil and Headline CPI Inflation This chart suggests that falling oil prices could easily lead to deflation. Image: J.P. Morgan
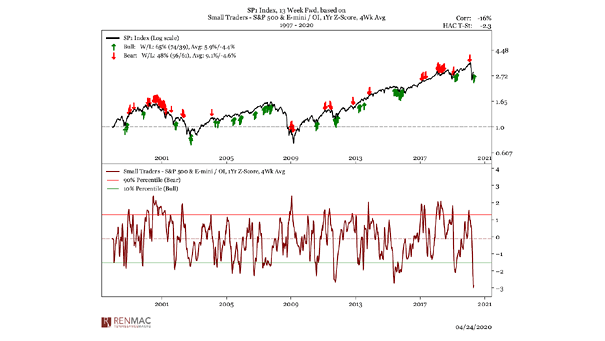
S&P 500 & E-mini – Small Traders Small trader positioning is still bearish, which is historically bullish for the S&P 500. Image: Renaissance Macro Research