Percentile of Sentiment Indicators since 2009
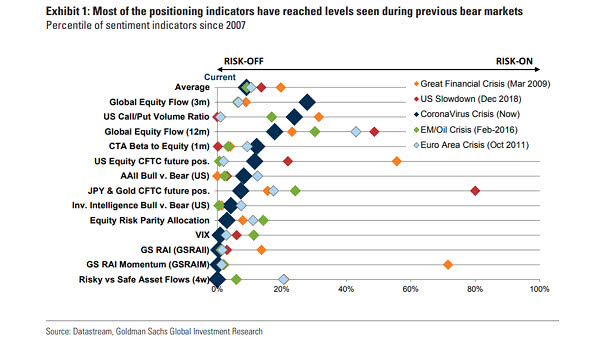
Percentile of Sentiment Indicators since 2009 Most market sentiment indicators are reaching low levels. Image: Goldman Sachs Global Investment Research
Percentile of Sentiment Indicators since 2009 Most market sentiment indicators are reaching low levels. Image: Goldman Sachs Global Investment Research
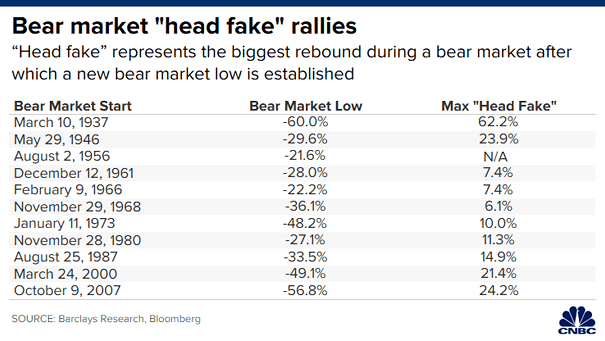
Bear Market “Head Fake” Rallies Since 1937, eleven bear markets experienced a “head fake” rally, when the real economic pain began in the United States. Image: CNBC
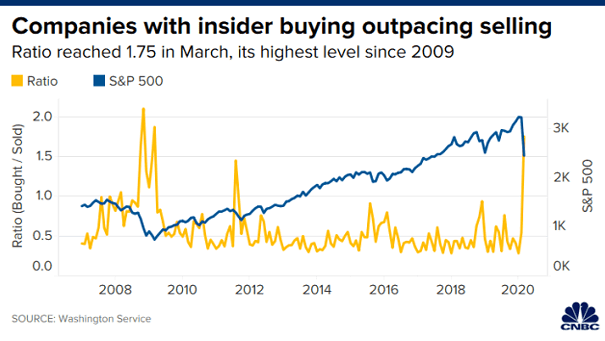
S&P 500 and Insider Buy vs. Sell Ratio Insider buying is at its highest level in nine years, as executives are confident their businesses will recover. Image: CNBC
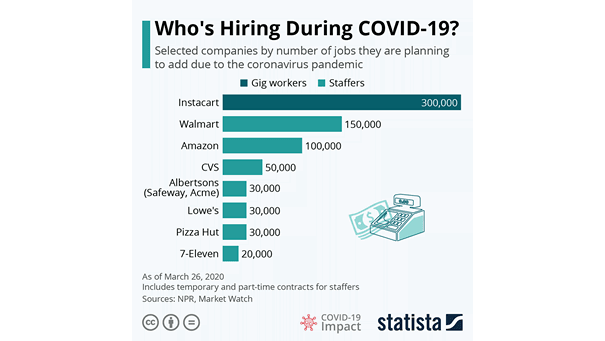
Selected Companies by Number of Jobs They are Planning to Add Due to the Coronavirus Pandemic Some companies are hiring during the coronavirus pandemic. Image: Statista
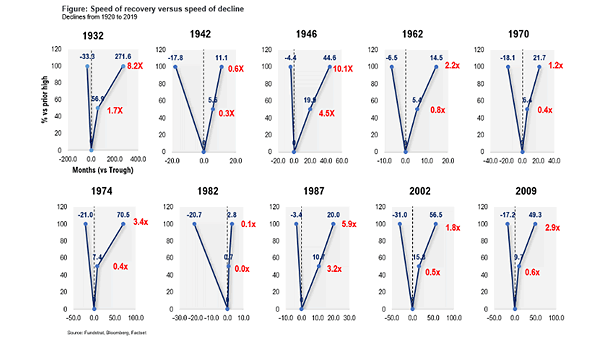
S&P 500 – Speed of Recovery vs. Speed of Decline This chart shows 10 declines more than 30% since 1920, and the speed of recovery vs. the speed of decline. The current decline has been…
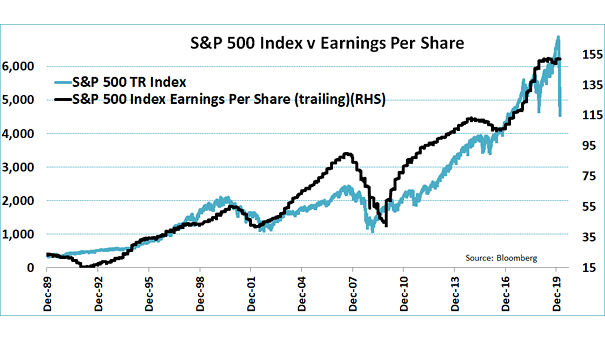
S&P 500 Index vs. Earnings per Share (EPS) Currently, the S&P 500 Index prices in a 15% decline in EPS. A decline of 33% from 2019 seems more appropriate, according to Goldman Sachs. Image: Jeroen…
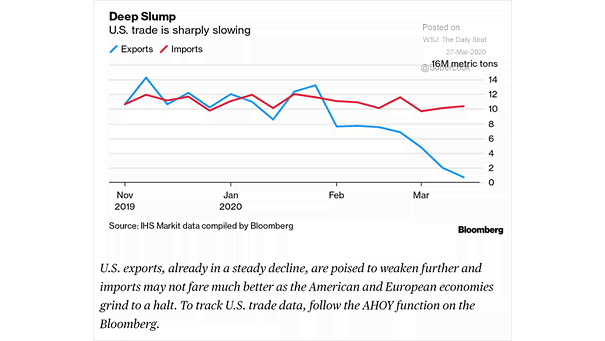
U.S. Trade Is Sharply Slowing (Imports – Exports) This chart shows the U.S. trade collapse, as the coronavirus plunges the global economy into recession. Image: Bloomberg
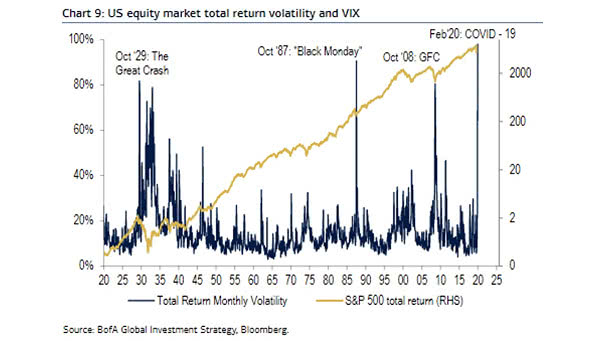
U.S. Equity Market Total Return Volatility and VIX Currently, the monthly volatility of U.S. equities is the highest on record. Image: BofA Global Investment Strategy
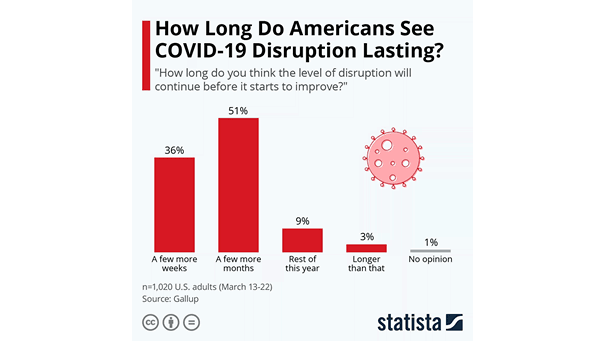
How Long Do Americans See Coronavirus Disruption Lasting? 51% of Americans see coronavirus disruption lasting a few more months. Image: Statista
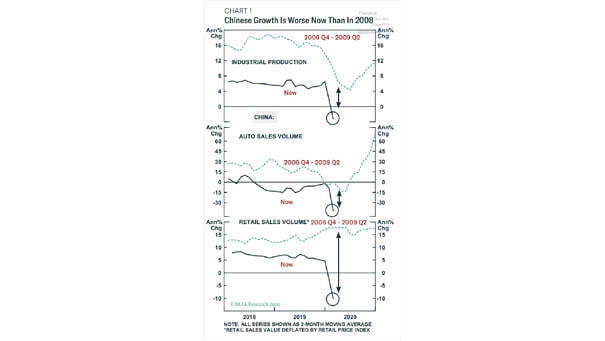
Economic Growth in China As the chart shows, Chinese growth is worse than in 2008. Image: BCA Research
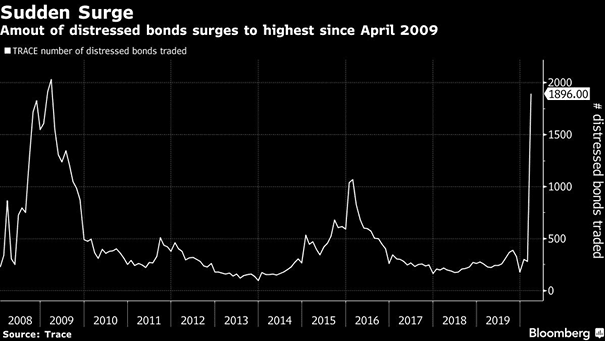
Amount of Distressed Bonds Driven by the coronavirus pandemic and the collapse of oil prices, the amount of distressed bonds has surged to the highest level since 2009. Image: Bloomberg