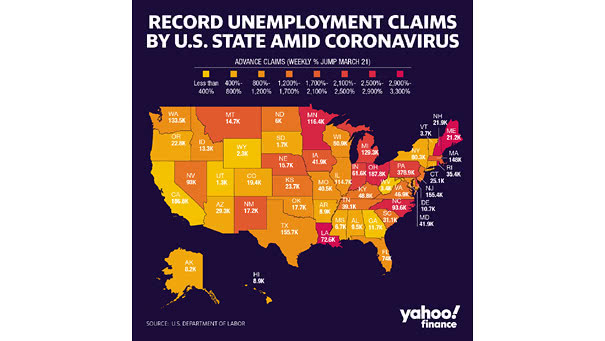
U.S. Jobless Claims by States
U.S. Jobless Claims by States Coronavirus job losses hit the following states the hardest. Image: Yahoo Finance
U.S. Jobless Claims by States Coronavirus job losses hit the following states the hardest. Image: Yahoo Finance
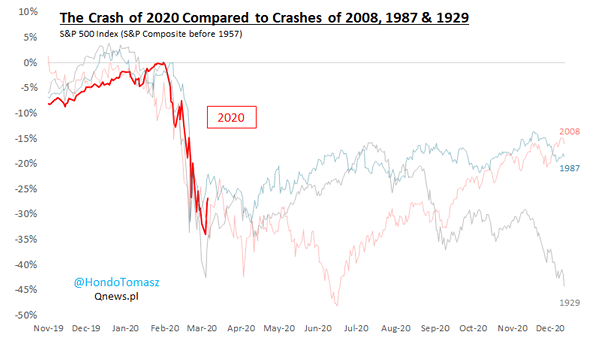
S&P 500 Index – The Crash of 2020 Compared to Crashes of 2008, 1987 and 1929 This chart compares the current decline with 2008, 1987 and 1929 crashes. Image: Tomasz Hońdo
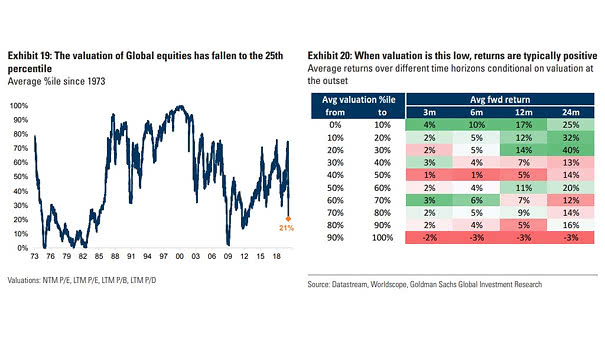
Valuation of Global Equities When valuation of global equities is this low, returns are typically positive Image: Goldman Sachs Global Investment Research
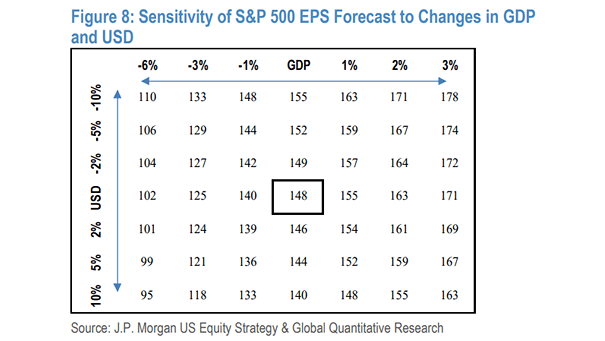
Sensitivity of S&P 500 EPS Forecast to Changes in GDP and the U.S. Dollar This table suggests the sensitivity of S&P 500 EPS forecast to changes in GDP and the U.S. dollar. Image: J.P. Morgan…
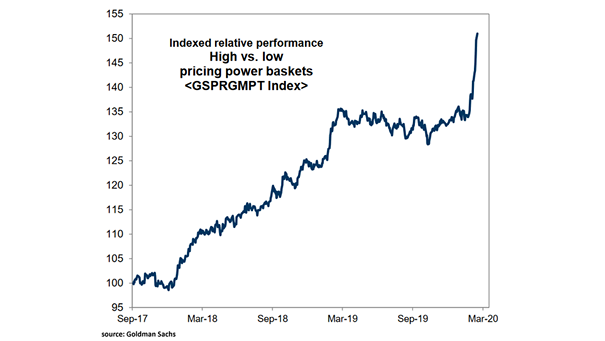
High vs. Low Pricing Power and Stocks Performance Companies with a high pricing power have outperformed significantly in recent years. Image: Goldman Sachs Global Investment Research
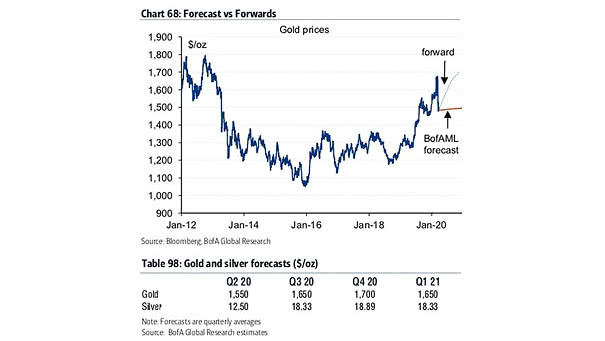
Gold and Silver Forecasts Bank of America forecasts gold price $1700 by year-end. Image: BofA Global Research
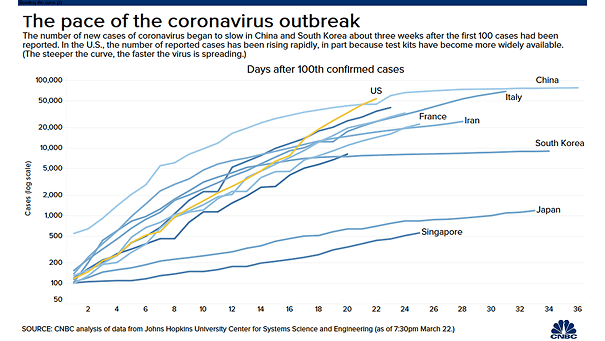
The Pace of the Coronavirus Outbreak The number of confirmed coronavirus cases continues to grow rapidly in the United States. Image: CNBC
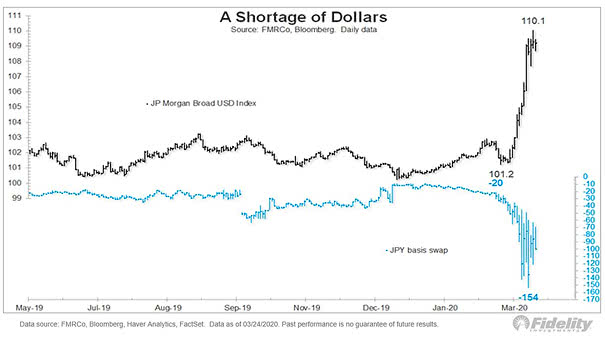
Shortage of U.S. Dollar A severe shortage of U.S. dollar could contribute to a decline in the volume of trade. Image: Fidelity Investments
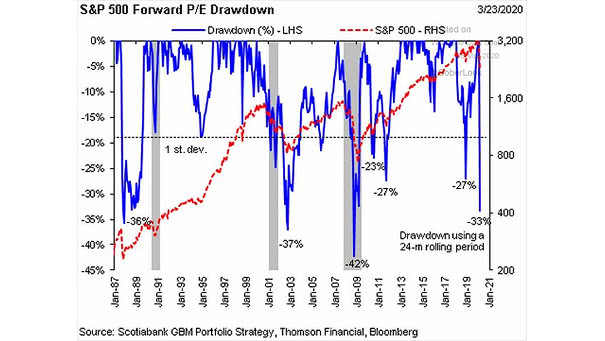
S&P 500 Forward P/E Drawdown This chart puts the S&P 500 forward P/E drawdown into perspective. Image: Scotiabank GBM Portfolio Strategy
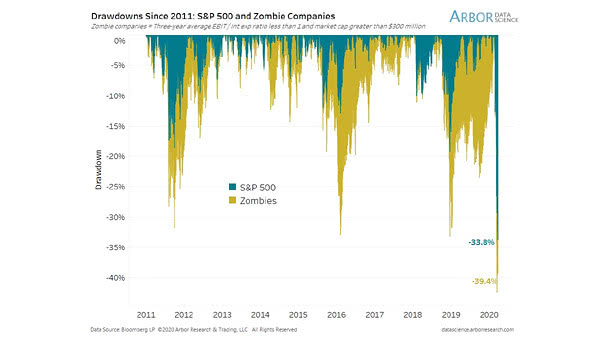
Drawdowns Since 2011 – S&P 500 vs. Zombie Companies U.S. zombie companies have significantly underperformed the S&P 500 since 2011. Image: Arbor Research & Trading LLC
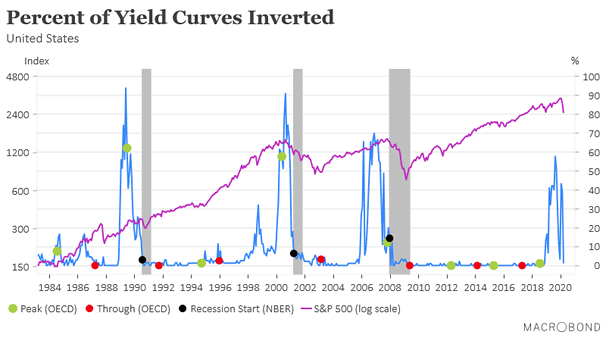
Percent of Yield Curves Inverted In recent history, U.S. recessions were preceded by yield curve inversion. It’s not different this time. Image: Macrobond Financial