S&P 500 from Record Peaks to a Correction
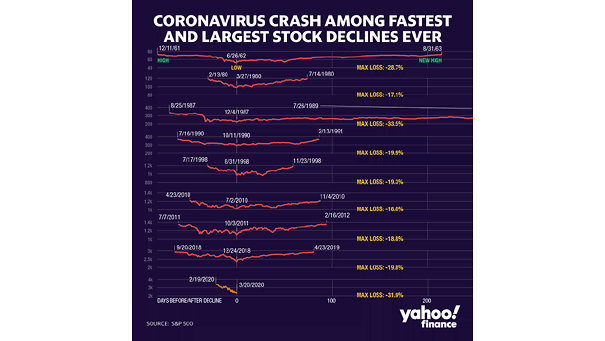
S&P 500 from Record Peaks to a Correction This chart puts the coronavirus crash into perspective. Image: Yahoo Finance
S&P 500 from Record Peaks to a Correction This chart puts the coronavirus crash into perspective. Image: Yahoo Finance
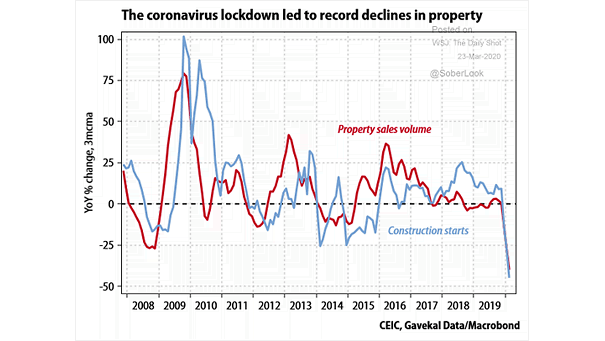
Housing – Property Sales Volume and Construction Starts This chart shows the impact of the coronavirus crisis on the property market. Image: Gavekal, Macrobond
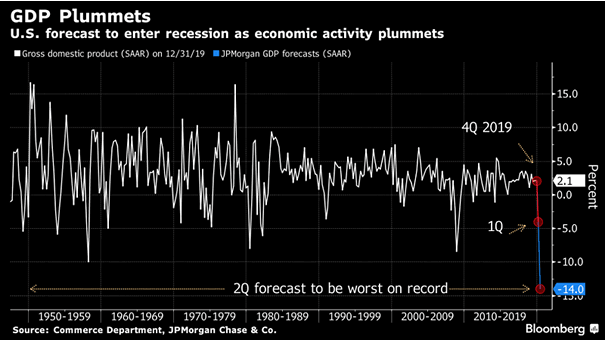
U.S. GDP Forecast for 2020 J.P. Morgan suggests that U.S. GDP in Q2 will be the worst on record. Image: Bloomberg
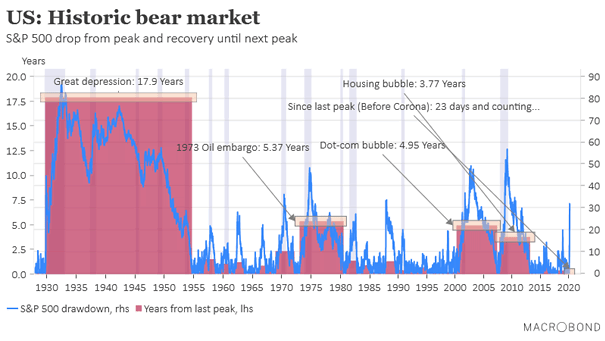
Historic U.S. Bear Market This chart shows the S&P 500 drop from peak and recovery until next peak. Image: Macrobond Financial
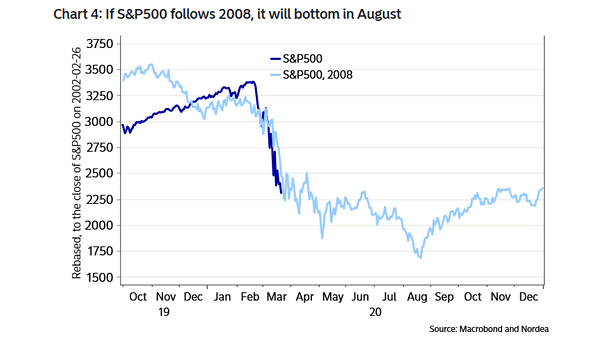
S&P 500 in 2020 and Similarities with 2008 If the S&P 500 follows the 2008 trajectory, it could bottom in August 2020. Image: Nordea and Macrobond
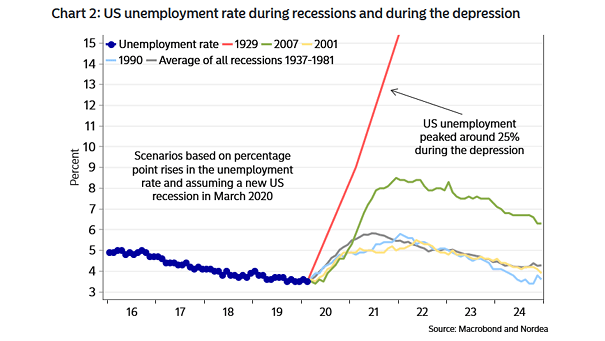
U.S. Unemployment Rate Average of All Recessions This chart puts into perspective the U.S. unemployment rate during recessions and during the depression. Image: Nordea and Macrobond
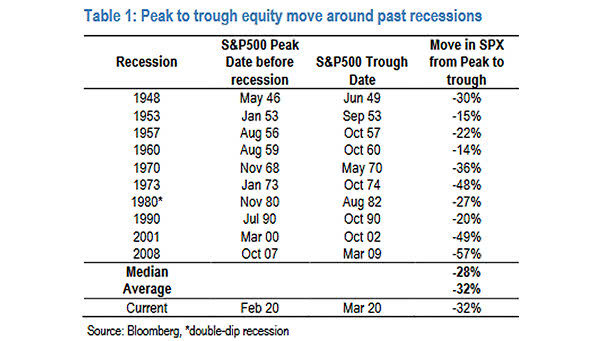
Peak to Trough Equity Move Around Past Recessions Historically, the average move in the S&P 500 from peak to trough around past recessions is -32%. Image: J.P. Morgan
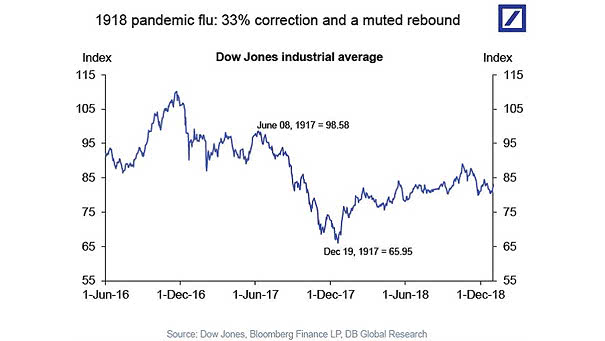
Dow Jones Industrial Average and 1918 Pandemic Flu During the influenza pandemic of 1918, the Dow Jones fell 33% and the rebound was muted. Image: Deutsche Bank Global Research
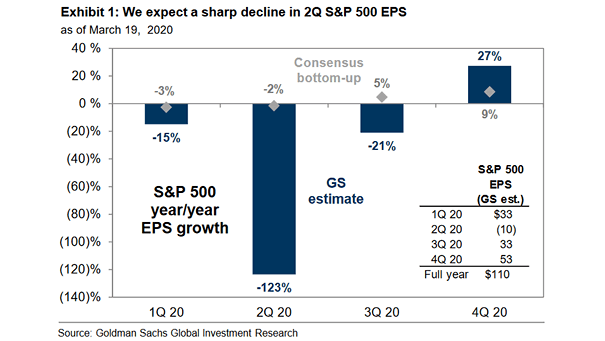
S&P 500 YoY EPS Growth Goldman Sachs now forecasts S&P 500 EPS of $110 this year. Image: Goldman Sachs Global Investment Research
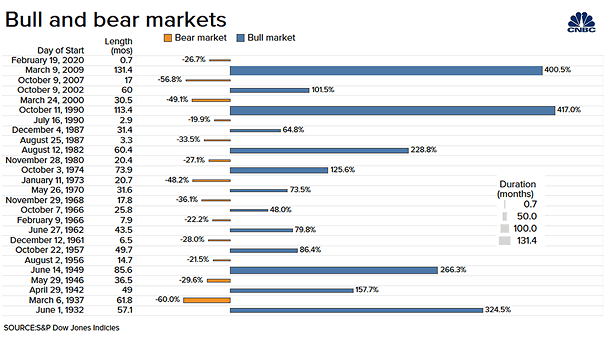
Bull and Bear Markets This chart shows the S&P 500′s returns in bull and bear markets through history. Image: CNBC
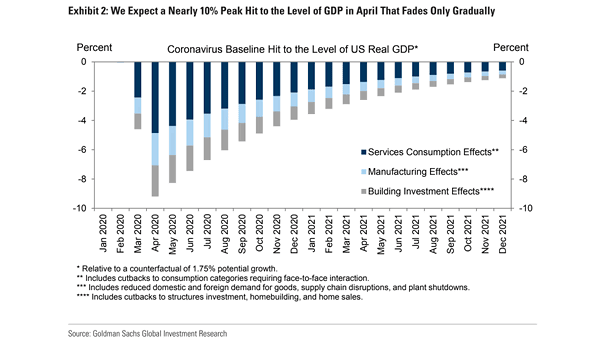
Coronavirus Baseline Hit to the Level of U.S. Real GDP Goldman Sachs expects a nearly 10% peak hit to the level of U.S. GDP next month, which will gradually fade away. Image: Goldman Sachs Global…