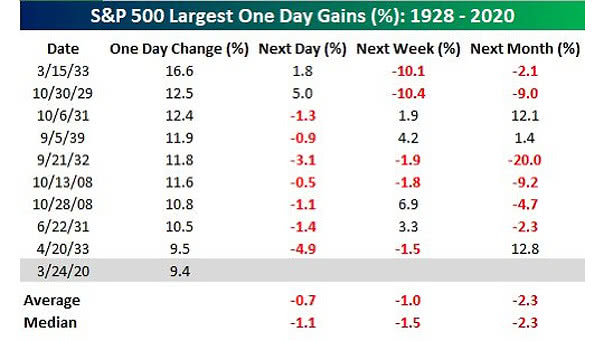
S&P 500 Largest One Day Gains 1928 – 2020
S&P 500 Largest One Day Gains 1928 – 2020 The largest daily gains in the S&P 500 tend to occur during secular bear markets. Image: Bespoke Investment Group
S&P 500 Largest One Day Gains 1928 – 2020 The largest daily gains in the S&P 500 tend to occur during secular bear markets. Image: Bespoke Investment Group
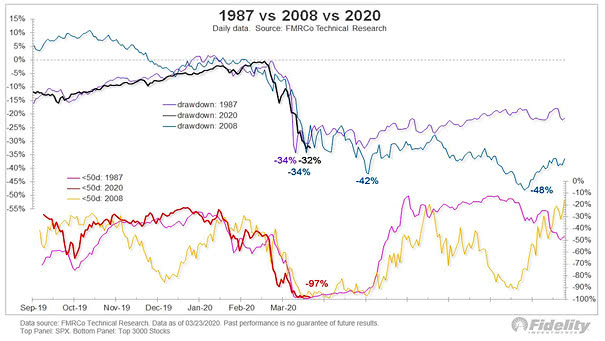
S&P 500 – 1987 vs. 2008 vs. 2020 This chart shows the percentage of stocks below their 50-day moving average vs. the 1987 & 2008 drawdowns. Image: Fidelity Investments
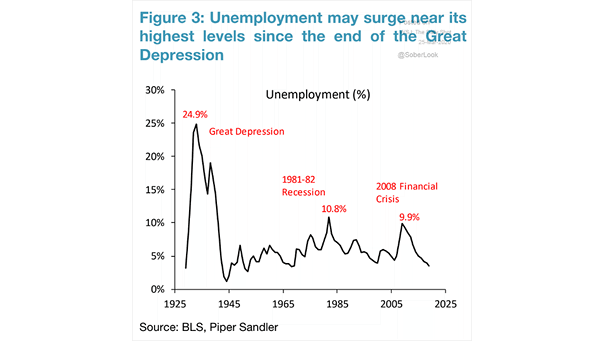
U.S. Unemployment Rate Expected in 2020 Dr. James Bullard, President of the Federal Reserve Bank of St. Louis, said that the U.S. unemployment rate may hit 30% in Q2 2020. Image: Piper Sandler
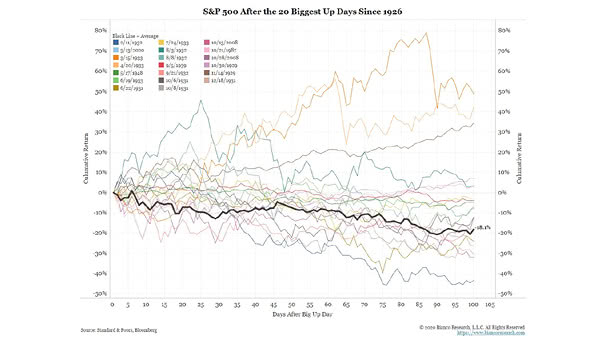
S&P 500 After the 20 Biggest Up Days Since 1926 Since 1926, after the 20 biggest up days, 70% are lower 100 days later and the decline going forward is -18.1% on average. Image: Bianco…
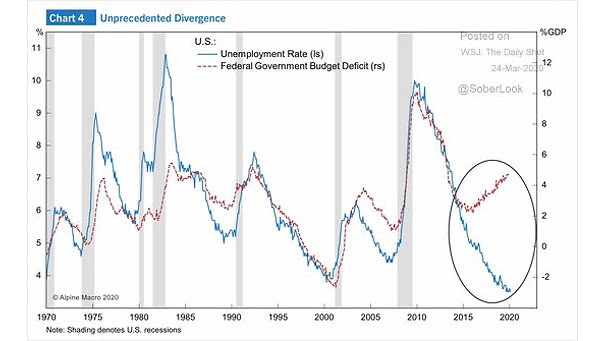
U.S. Unemployment Rate and U.S. Federal Government Budget Deficit This chart shows the unprecedented divergence between the U.S. unemployment rate and the U.S. federal government budget deficit. Image: Alpine Macro
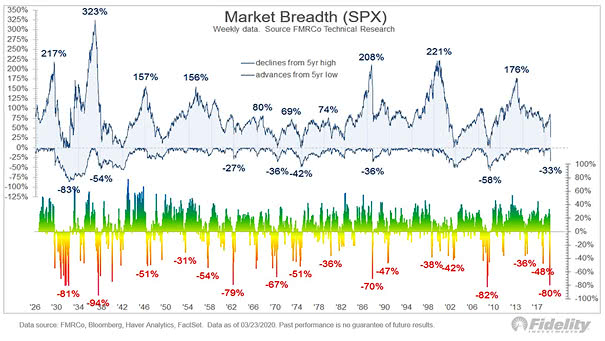
Market Breadth (S&P 500) New 52-week highs minus new 52-week lows is the third lowest in history after 2008 and the 1930s. Image: Fidelity Investments
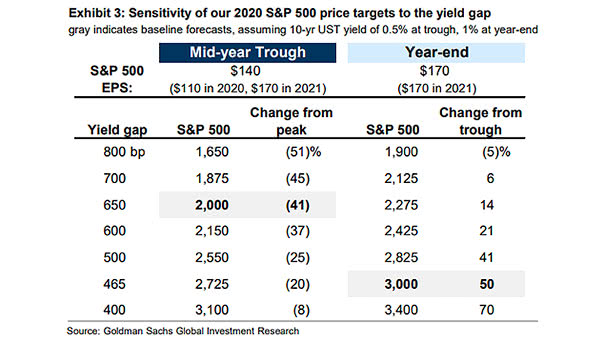
Sensitivity of the 2020 S&P 500 Price Targets to the Yield Gap Goldman Sachs expects the yield gap to narrow by year-end 2020. Image: Goldman Sachs Global Investment Research
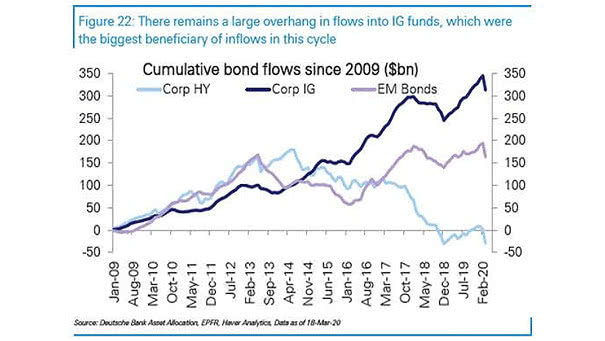
Cumulative Bond Flows Since 2009 Flows into high-yield funds had been out of favor in this cycle. Is this good news? Image: Deutsche Bank Asset Allocation
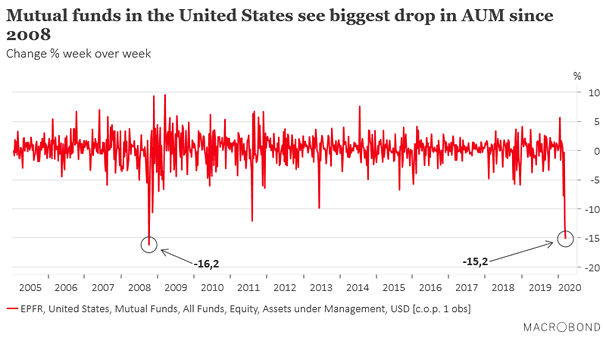
U.S. Equity Mutual Funds Flow U.S. equity mutual funds have experienced the biggest drop in asset under management since 2008. Image: Macrobond Financial
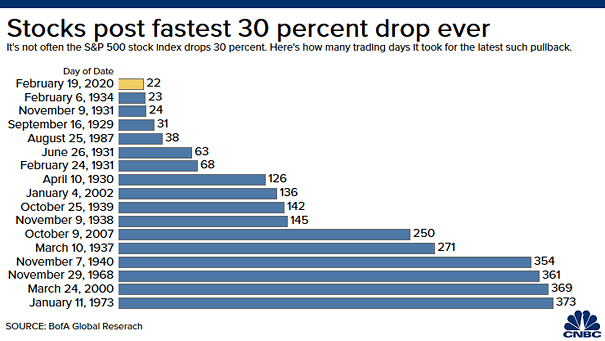
S&P 500 30% Pullbacks It took only 22 trading days for the S&P 500 to fall 30% from its record high. Image: CNBC

Gold, U.S. Trade Weighted Dollar and S&P 500 In 2008, gold outperperformed after the Fed stepped in and removed liquidity constraints. Image: Goldman Sachs Global Investment Research