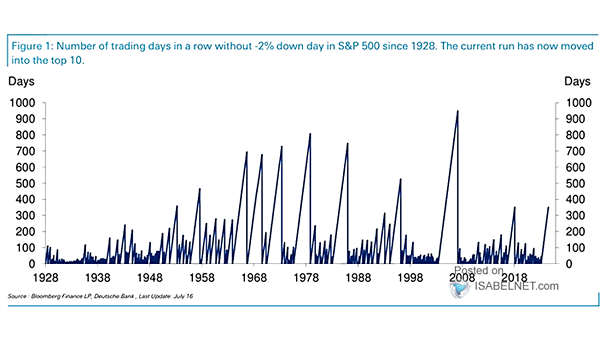
ISABELNET Cartoon of the Day

ISABELNET Cartoon of the Day The “Liberation Day” effect has set equity markets free—free to plummet, that is! Have a Great Week, Everyone! 😎

Impact on U.S. YoY Real GDP Growth

Impact on U.S. YoY Real GDP Growth Goldman Sachs has cut its 2025 Q4/Q4 GDP growth forecast to 0.5% and raised its 12-month recession probability from 35% to 45%, citing tighter financial conditions, foreign consumer…

U.S. High Yield Credit Spreads vs. VIX

U.S. High Yield Credit Spreads vs. VIX High-yield credit spreads have widened by over 150bps from their 17-year lows, signaling growing financial stress. While rising credit spreads have often been a precursor to recessions, they…

S&P 500 Annualized 10-Year Total Return Forecasts

S&P 500 Annualized 10-Year Total Return Forecasts Goldman Sachs forecasts a 3% average annualized total return for the S&P 500 over the next decade. This projection is notably lower than historical averages, driven by worries…

Large U.S. Tax Hikes

Large U.S. Tax Hikes Trump’s tariffs represent the most significant U.S. tax increase since 1968, raising widespread concerns about their long-term effects on the economy. Image: J.P. Morgan

ISABELNET Cartoon of the Day

ISABELNET Cartoon of the Day As the S&P 500 tumbles 9.08% this week, bears are popping champagne, and bulls are asking, “Is there even a floor anymore?” Have a Great Weekend, Everyone! 😎

ISABELNET Cartoon of the Day

ISABELNET Cartoon of the Day As bears heard Trump’s tariffs were going to cause a bear market, bulls suddenly came down with a case of stagflation! Happy Friday, Everyone! 😎

EPS Revisions

EPS Revisions Typically, positive revisions in EPS increase stock market value and attract more investors, while negative revisions usually apply downward pressure on stock prices. Image: Goldman Sachs Global Investment Research

VIX Futures Curve

VIX Futures Curve Market participants are anticipating a potential decline in volatility, reflecting hopes for reduced uncertainty and stabilization of trade-related concerns impacting markets. Image: The Daily Shot

NBER Recession Dating vs. Market Realization

NBER Recession Dating vs. Market Realization Historically, the S&P 500 peaks and declines 6–16 months before the National Bureau of Economic Research (NBER) officially declares a U.S. recession, making it a reliable leading indicator. Image:…

Average Daily Equity ETF Flow vs. S&P 500 Performance

Average Daily Equity ETF Flow vs. S&P 500 Performance Despite the S&P 500’s decline in Q1 2025, investors continued pouring money into equity ETFs, averaging nearly $3bn daily inflows—a sign of persistent appetite for U.S.…