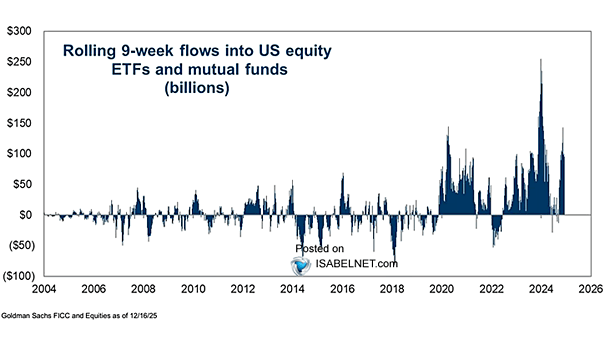
U.S. Core CPI Minus Unemployement Rate % vs. Fed Funds Rate

U.S. Core CPI Minus Unemployement Rate % vs. Fed Funds Rate The Fed rarely cuts rates when core CPI exceeds the unemployment rate, reflecting the central bank’s concern about potential inflationary pressures in the economy…

U.S. Federal Debt Held by the Public

U.S. Federal Debt Held by the Public The projected ballooning of the U.S. federal debt by 2050 could have negative impacts on the U.S. economy, with more interest payments, limited resources, and potential constraints on…

Stocks vs. Bonds – Relative Allocations

Stocks vs. Bonds – Relative Allocations U.S. stocks are relatively expensive compared to bonds. Are investors too aggressively positioned in U.S. stocks relative to bonds? Image: Topdown Charts

Fed Funds vs. VIX

Fed Funds vs. VIX Given the lag effect of Fed rate hikes on the U.S. economy, should investors expect a near-future rise in the VIX, or is this time different? Image: Deutsche Bank

S&P 500 vs. 1982 Analog

S&P 500 vs. 1982 Analog With financial conditions easing considerably and the Fed set to cut rates in 2024, will the S&P 500 continue to track the 1982 analog? Image: Fundstrat Global Advisors, LLC

S&P 500 Seasonality

S&P 500 Seasonality Analyzing historical trends can provide investors and traders with valuable insights, as it helps to understand the S&P 500’s past performance in the fourth quarter. Image: Goldman Sachs

Fed Balance Sheet Expansion/Contraction vs. S&P 500

Fed Balance Sheet Expansion/Contraction vs. S&P 500 The contraction of the Fed’s balance sheet tends to be a headwind for the S&P 500, as reduced liquidity in the financial system may have negative implications for…

U.S. Household Liquid Assets

U.S. Household Liquid Assets The amount of cash and equivalents held by households in the United States has reached an unprecedented level of $18 trillion. Image: BofA Research Investment Committee