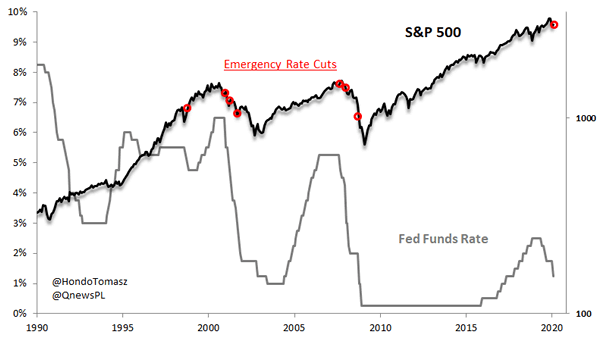
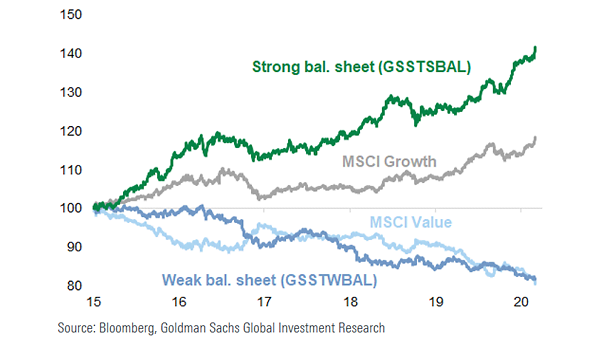
S&P 500 and Secular Bull Market Corrections

S&P 500 and Secular Bull Market Corrections Chart suggesting that the 100-week MA and the 200-week MA are key secular market supports. Image: BofA Global Research

Momentum Signal Across Asset Classes

Momentum Signal Across Asset Classes Momentum signals across all asset classes have flipped to extreme risk-off. Image: Deutsche Bank Asset Allocation

Gold and U.S. Treasuries

Gold and U.S. Treasuries Chart suggesting that gold and U.S. Treasuries remain the safe haven of choice. Image: Gavekal, Macrobond

Coronavirus Fatality Rate by Age

Coronavirus Fatality Rate by Age This chart shows the breakdowns of coronavirus fatality rate by age. Image: LPL Research

Listed Companies vs. Investment Funds

Listed Companies vs. Investment Funds There are almost as many equity investment funds as there are stocks to invest in. Image: Topdown Charts

Gold Prices during U.S. Recessions

Gold Prices during U.S. Recessions Historically, gold prices have performed fairly well on average during U.S. recessions. Image: Nordea and Macrobond