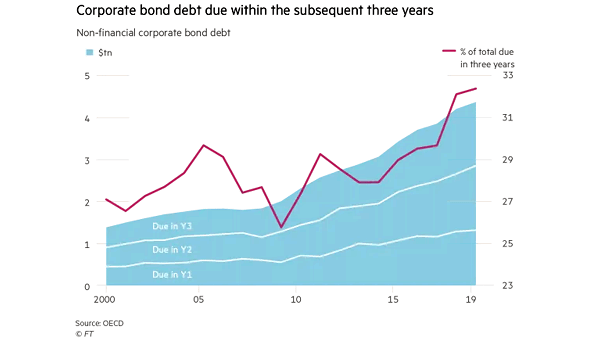
Non-Financial Corporate Bond Debt
Non-Financial Corporate Bond Debt Chart showing the corporate bond debt due within the subsequent three years. Is this where the next debt crisis will begin? Image: Financial Times
Non-Financial Corporate Bond Debt Chart showing the corporate bond debt due within the subsequent three years. Is this where the next debt crisis will begin? Image: Financial Times
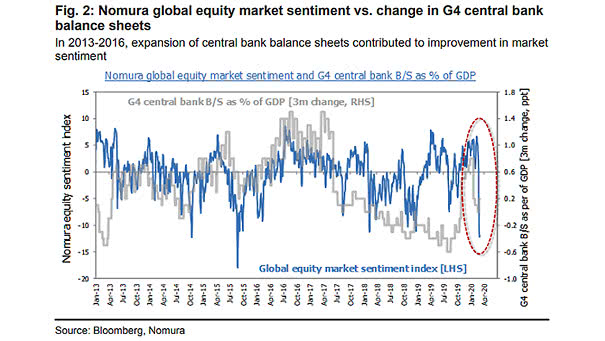
Global Equity Market Sentiment vs. Change in G4 Central Bank Balance Sheets In 2013 and 2016, the expansion of central bank balance sheets contributed to improved market sentiment. Image: Nomura
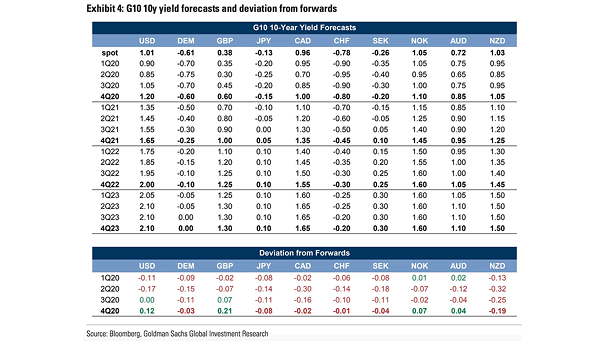
G10 10-Year Yield Forecasts and Deviation from Forwards Goldman Sachs has lowered its G10 10-year yield forecasts, due to the coronavirus outbreak. Image: Goldman Sachs Global Investment Research
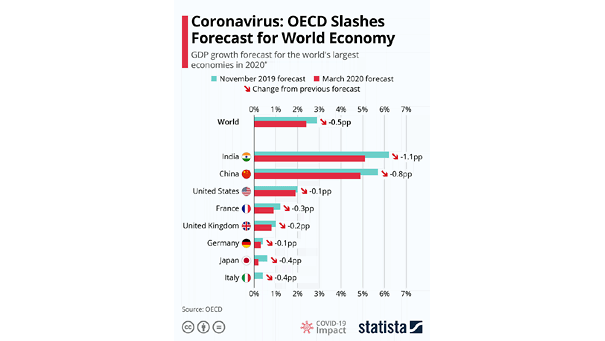
GDP Growth Forecast for the World’s Largest Economies in 2020 The OECD expects the world economy to grow by 2.4% in 2020. Image: Statista
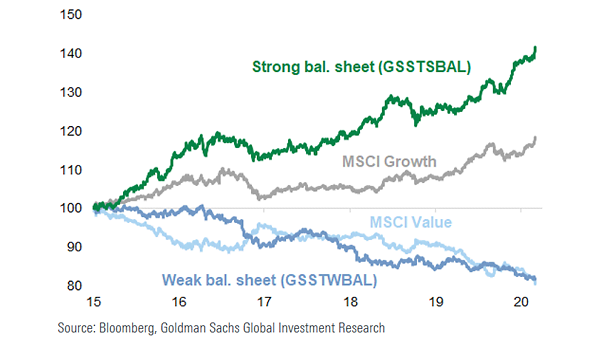
Companies with Strong Balance Sheet vs. Companies with Weak Balance Sheet Companies with strong balance sheet have outperformed companies with weak balance sheet. Typically, companies with weak balance sheet invest less. Image: Goldman Sachs Global…
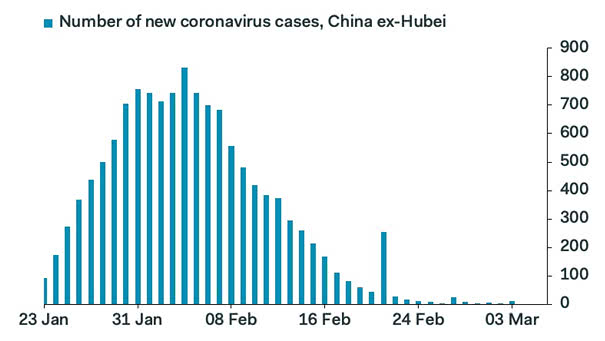
Number of New Coronavirus Cases, China ex-Hubei A continued decline in the number of new coronavirus cases from China ex-Hubei province is encouraging. Image: Pantheon Macroeconomics
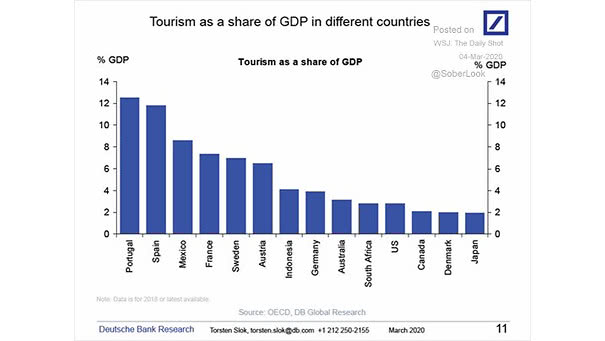
Tourism as a Share of GDP in Different Countries The spread of coronavirus in Europe could affect its tourism industry. Image: Deutsche Bank Global Research
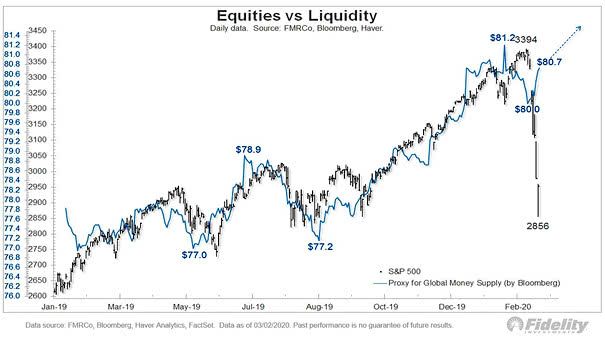
S&P 500 and Global Money Supply Chart suggesting that global money supply tends to push U.S. equities higher. Image: Fidelity Investments
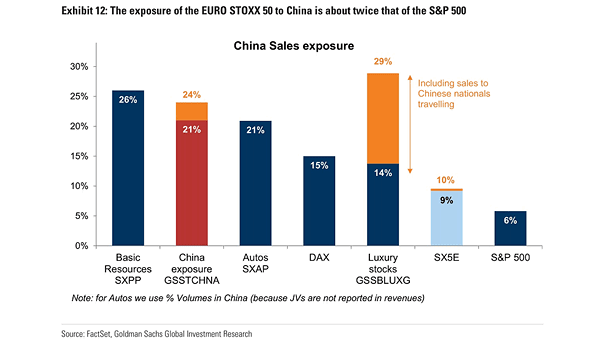
China Sales Exposure – Euro Stoxx 50 vs. S&P 500 Europe equities are more sensitive than the U.S. market, as the exposure of the Euro Stoxx 50 index to China is about twice that of…
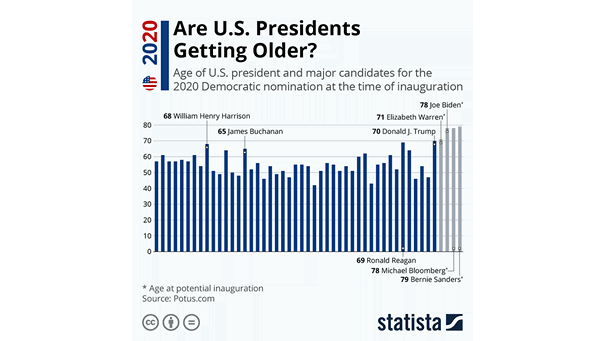
Age of U.S. President and Major Candidates for the 2020 Democratic Nomination at the Time of Inauguration How old is too old to be president in the United States? Image: Statista
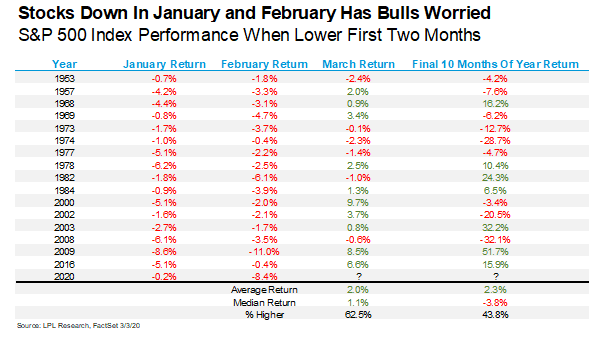
S&P 500 Index Performance When Lower First Two Months Historically, when the S&P 500 index was down in January and February, the entire year was down almost 5% on average. Image: LPL Research