Momentum Signal Across Asset Classes
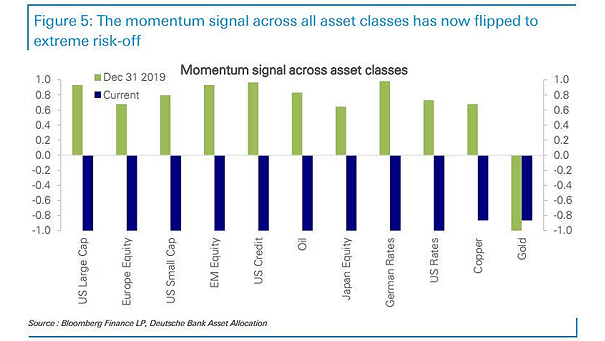
Momentum Signal Across Asset Classes Momentum signals across all asset classes have flipped to extreme risk-off. Image: Deutsche Bank Asset Allocation
Momentum Signal Across Asset Classes Momentum signals across all asset classes have flipped to extreme risk-off. Image: Deutsche Bank Asset Allocation
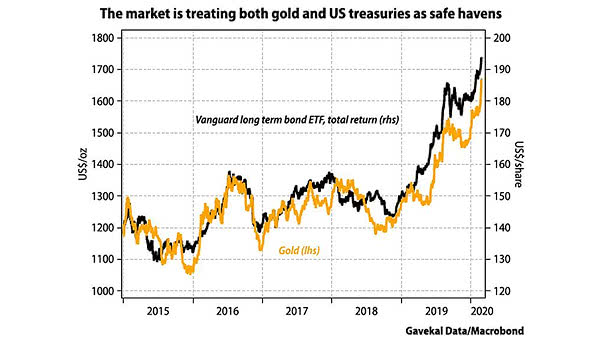
Gold and U.S. Treasuries Chart suggesting that gold and U.S. Treasuries remain the safe haven of choice. Image: Gavekal, Macrobond
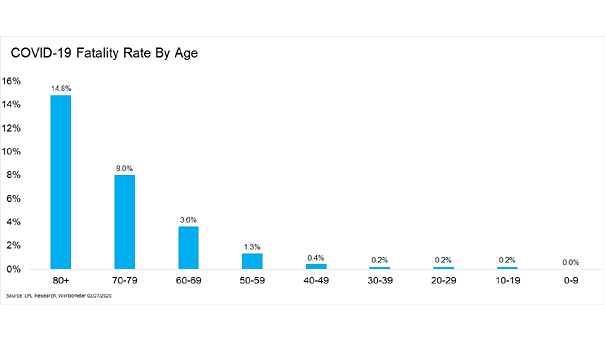
Coronavirus Fatality Rate by Age This chart shows the breakdowns of coronavirus fatality rate by age. Image: LPL Research
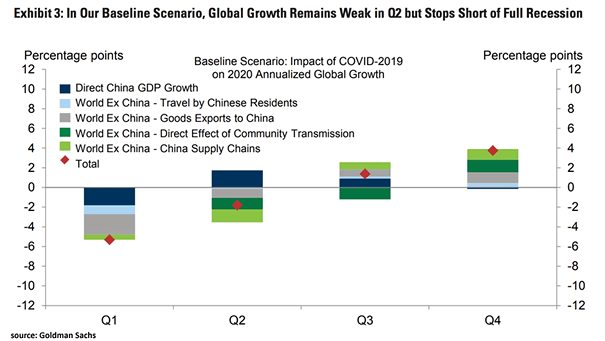
Baseline Scenario: Impact of Coronavirus on 2020 Annualized Global Growth (Global GDP) Goldman Sachs expects global growth to remain weak in Q2, and a rebound later in the year. Image: Goldman Sachs Global Investment Research
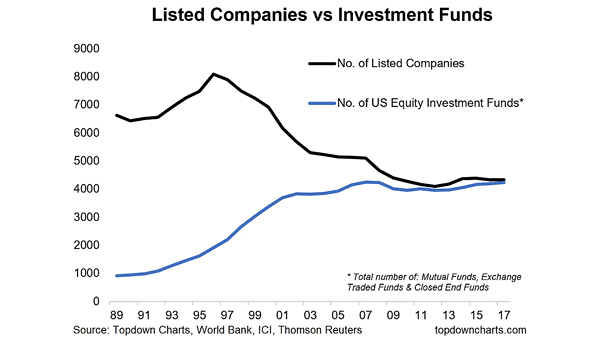
Listed Companies vs. Investment Funds There are almost as many equity investment funds as there are stocks to invest in. Image: Topdown Charts

The Countries Best and Worst Prepared for an Epidemic According to the 2019 Global Health Security Index, the U.S. has the greater level to respond to an epidemic or pandemic. Image: Statista
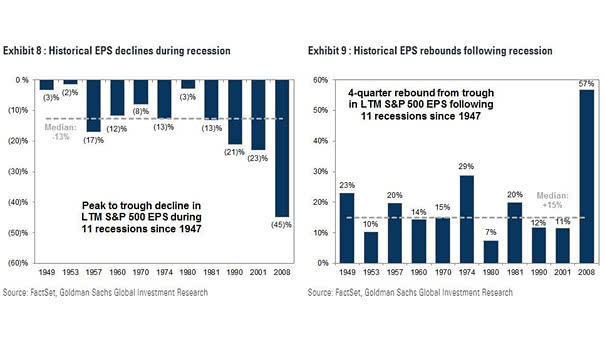
Historical EPS Declines during Recession and Historical EPS Rebounds following Recession Historically, S&P 500 EPS fall by 13% from peak to trough and rebound by 15% in the four quarters following recession. Image: Goldman Sachs…
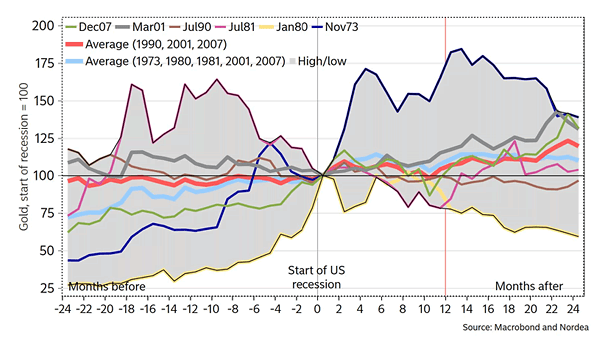
Gold Prices during U.S. Recessions Historically, gold prices have performed fairly well on average during U.S. recessions. Image: Nordea and Macrobond
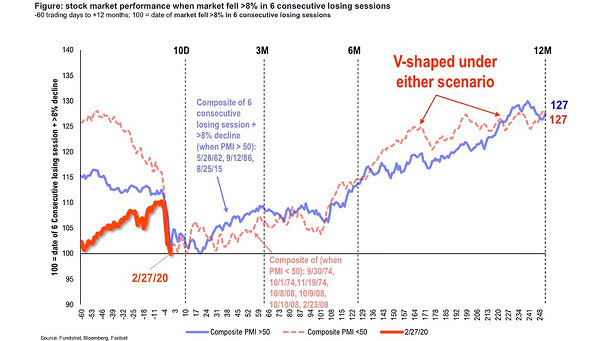
U.S. Stock Market Performance When Market Fell > 8% in 6 Consecutive Losing Sessions This chart shows the U.S. stock market performance since 1948, when the market fell more than 8% in 6 consecutive losing…
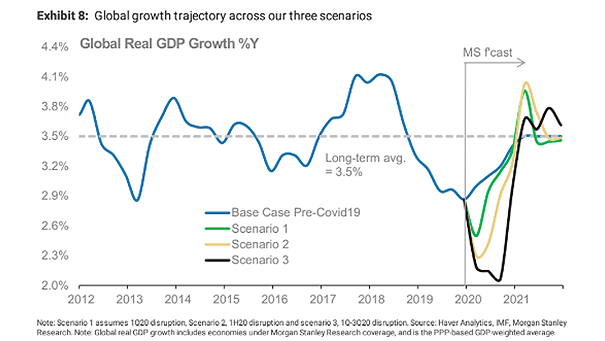
Global Real GDP Growth According to Morgan Stanley, the recovery is just being delayed and the second scenario appears the most likely: escalation and more disruption in the second quarter, and the virus peaks in…
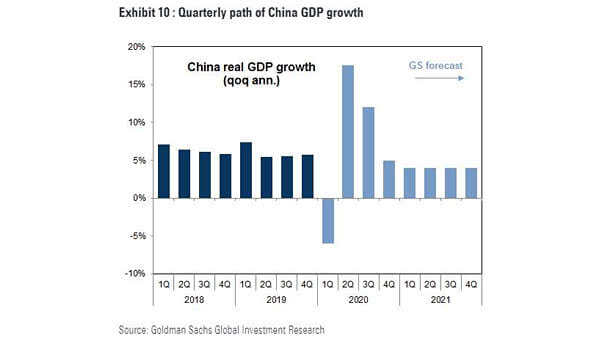
China Real GDP Growth Goldman Sachs expects that China’s real GDP growth will recover sharply following the 1Q contraction. Image: Goldman Sachs Global Investment Research