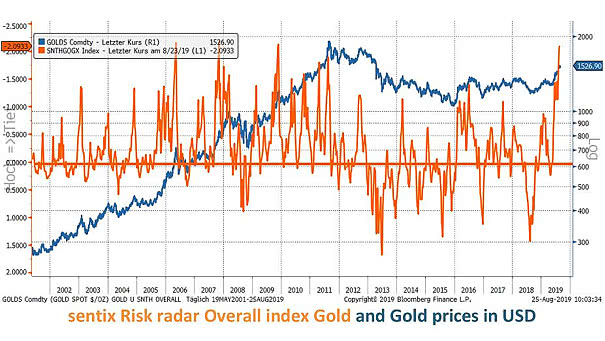
Gold Annual Returns
Gold Annual Returns Up 40% this year, gold is enjoying its strongest rally since 1979’s 133% surge. But so far, the rise has stirred far less hysteria than in earlier eras, leaving room for further…
Gold Annual Returns Up 40% this year, gold is enjoying its strongest rally since 1979’s 133% surge. But so far, the rise has stirred far less hysteria than in earlier eras, leaving room for further…
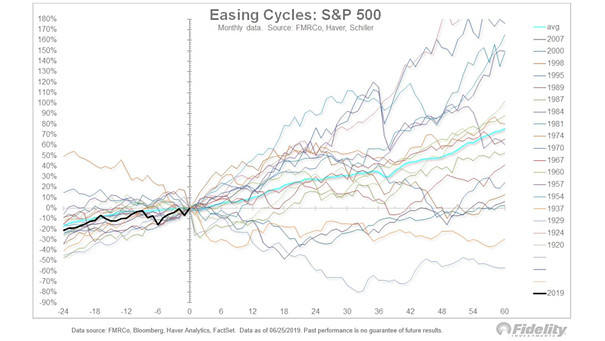
S&P 500 Index Around First Cut Following Easing Cycle Pauses of Six Months or More Historically, when the Fed resumes rate cuts after holding steady for at least six months, U.S. stocks often post strong…
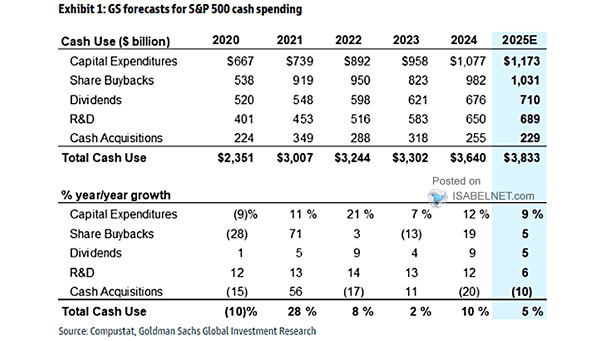
S&P 500 Cash Spending Relative to Cash Flows Many S&P 500 companies devote substantial cash flow to stock buybacks, a practice that benefits shareholders in the short term but sparks concerns about favoring short-term gains…
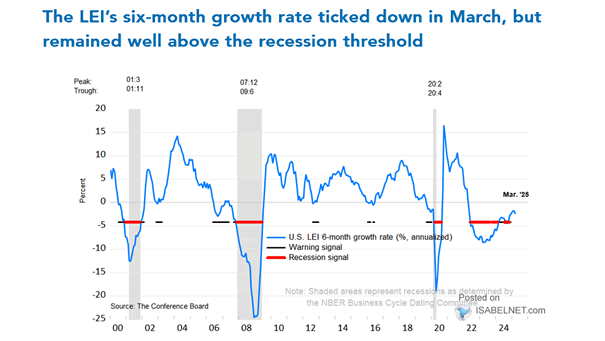
The Conference Board Leading Economic Index (LEI) for the U.S. A 0.5% decline in the U.S. Leading Economic Index (LEI) in August 2025 indicates an ongoing slowdown in U.S. economic activity. Image: The Conference Board
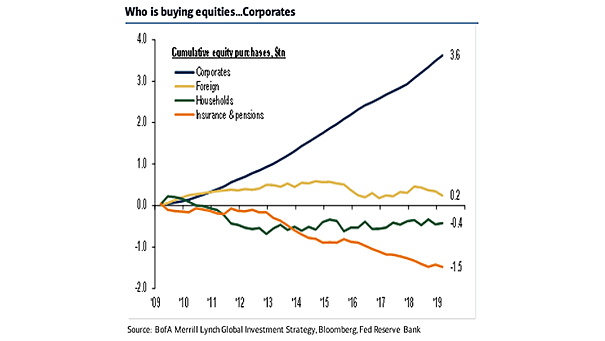
Buying U.S. Equity Securities In 2Q 2025, foreign investors boosted their holdings of U.S. equities, while U.S. households and hedge funds cut back amid market volatility and policy uncertainty. Image: Deutsche Bank
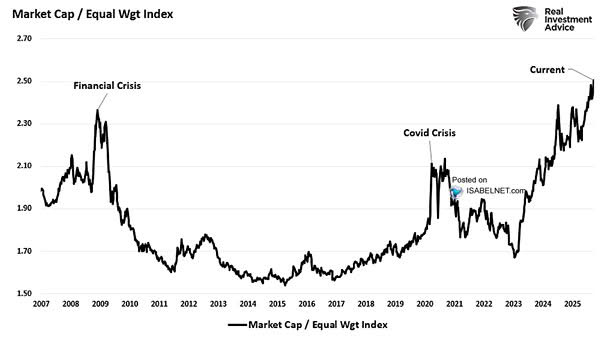
S&P 500 Market Cap / S&P 500 Equal Weight Index The current performance gap—where the market-cap-weighted index outperforms the equal-weight index—does not necessarily signal an imminent bear market, but it does warrant some caution for…
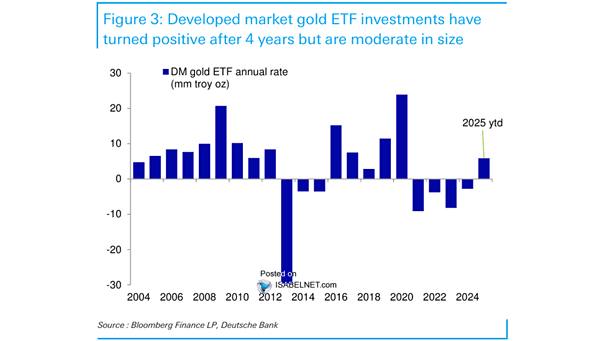
Gold ETF Holdings and COMEX Open Interest The confluence of rising gold ETF holdings, speculative flows, central bank buying, and macroeconomic factors has created strong bullish momentum for gold, which is likely to persist through…
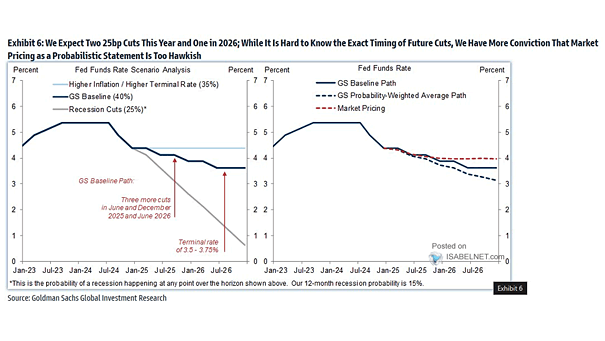
Fed Funds Rate By the end of 2026, Goldman Sachs anticipates four 25-basis-point cuts and expects the Fed to loosen monetary policy more than markets foresee, driven by worries about weaker employment growth and inflation…
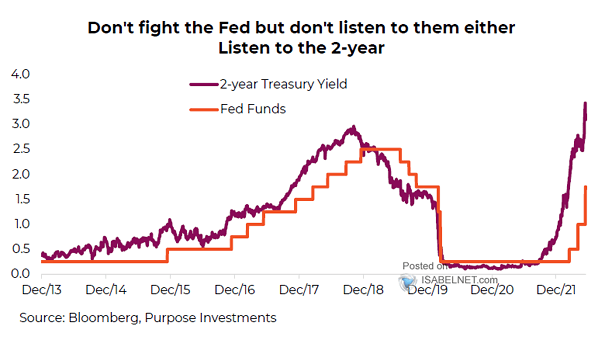
U.S. 2-Year Treasury Yield vs. Fed Funds The current 2-year U.S. Treasury yield, which is below the fed funds rate, signals that monetary policy is restrictive. It also implies the Fed is about 80 basis…
Annual S&P 500 Net Buyback Payout Ratio Over the past decade, the buyback payout ratio in the S&P 500 has remained high and relatively steady, with buybacks serving as a primary way of delivering value…
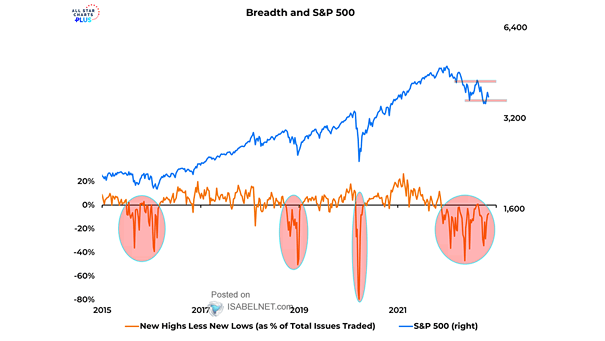
Breadth Thrusts and S&P 500 The ongoing Breadth Thrust Regime offers a powerful bullish signal, indicating favorable conditions for U.S. equities until at least May 2026, particularly with the S&P 500 reaching new highs. Image:…