U.S. Consumer Credit
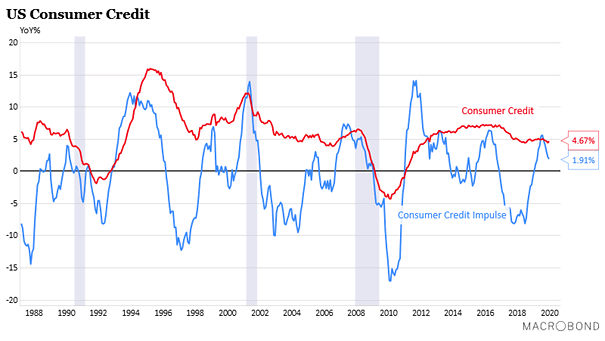
U.S. Consumer Credit The current downtrend in US consumer credit impulse could suggest a scenario of slowing growth this year. Image: Macrobond Financial
U.S. Consumer Credit The current downtrend in US consumer credit impulse could suggest a scenario of slowing growth this year. Image: Macrobond Financial
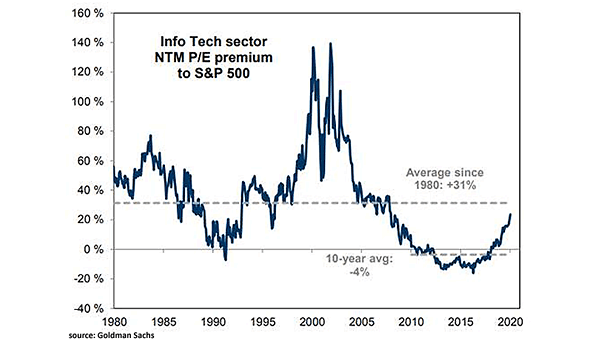
Info Tech Sector NTM P/E Premium to S&P 500 Is the tech sector expensive relative to the S&P 500? Image: Goldman Sachs Global Investment Research
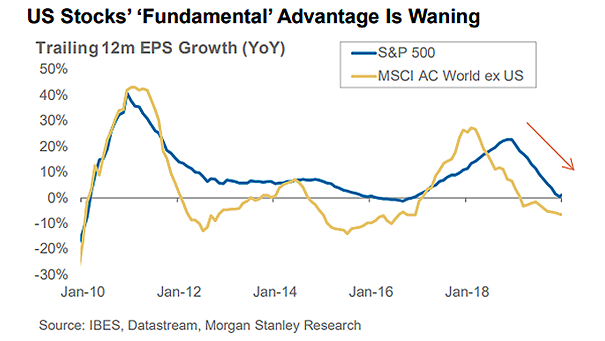
Trailing 12 Month EPS Growth: S&P 500 vs. MSCI AC World ex U.S. Chart suggesting that the “fundamental” advantage of U.S. stocks is diminishing. Image: Morgan Stanley Research
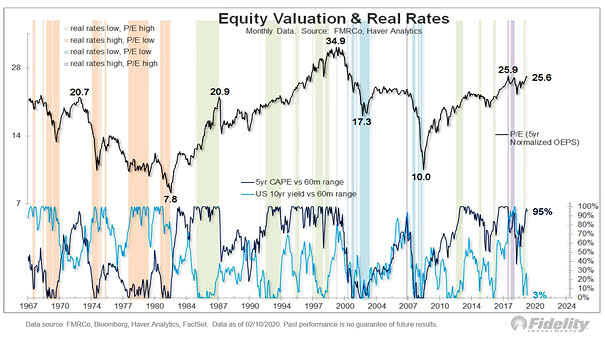
U.S. Equity Valuation and Real Rates This chart highlights the various regimes for rates and equities over time. Image: Fidelity Investments
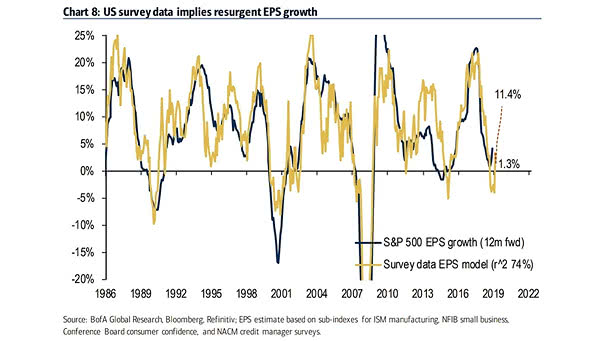
U.S. Survey Data and EPS Growth BofA’s model suggests 11.4% U.S. EPS growth by the end of Q2 2020. Image: BofA Global Research
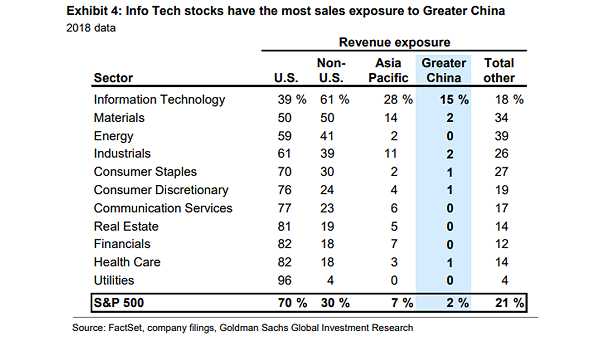
Info Tech Stocks and Sales Exposure to Greater China Stocks in the information technology sector have the most sales exposure to Greater China. Image: Goldman Sachs Global Investment Research
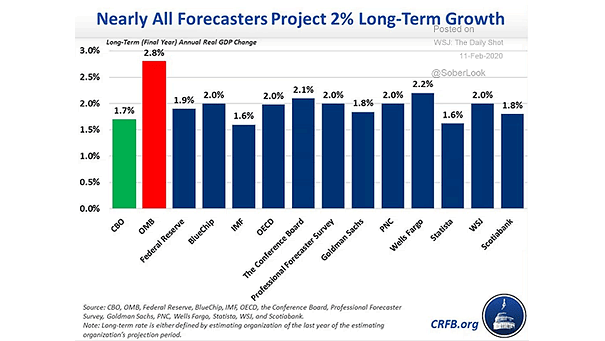
Long-Term Annual Real GDP Growth in the U.S. Most forecasters projects long-term real GDP growth of about 2% in the United States, except for the White House (Office of Management and Budget). Image: Committee for a…
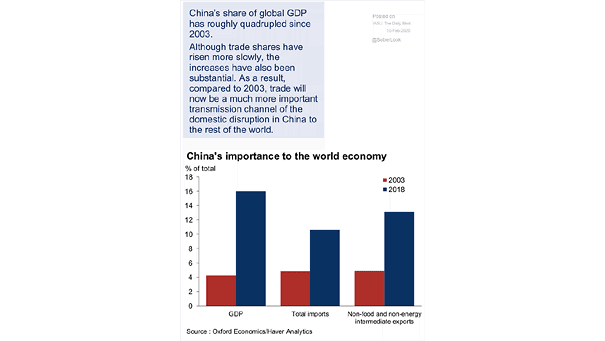
China’s Importance to the World Economy China plays a key role in the world economy, as China share of global GDP is much bigger today than it was in 2003. Image: Oxford Economics
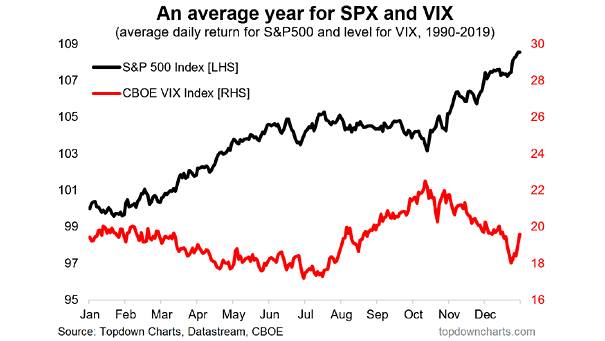
VIX and S&P 500 Seasonality The chart shows the seasonality map for the VIX and the S&P 500, and how they move in opposite directions. Image: Topdown Charts
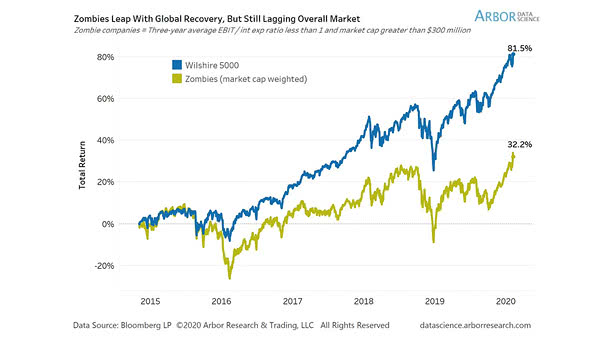
U.S. Zombie Companies and Wilshire 5000 Since the Fed ended QE in 2014, U.S. zombie companies have underperformed the stock market. Image: Arbor Research & Trading LLC

Probability of U.S. Recession vs. Initial Jobless Claims The probability of U.S. recession beginning within 12 months decreases. Image: J.P. Morgan