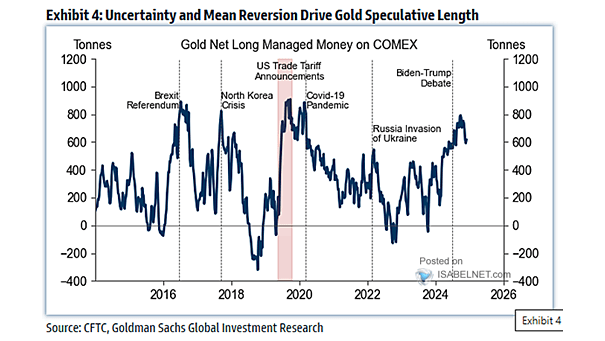
ISABELNET Cartoon of the Day

ISABELNET Cartoon of the Day Ignoring climate risks in your financial strategy is like leaving your umbrella at home on a cloudy day—you might be fine for a while, but you’ll regret it when the…

Equity Flows

Equity Flows U.S. equity flows have strengthened in early 2025, with investors pouring significant amounts of money into U.S. equity markets, aligning with analysts’ expectations of continued outperformance. Image: Goldman Sachs Global Investment Research

Buybacks and S&P 500 Use of Cash

Buybacks and S&P 500 Use of Cash S&P 500 companies are showing stronger growth in capital expenditure compared to share buybacks, signaling a shift in corporate spending priorities. Image: Goldman Sachs Global Investment Research

ISABELNET Cartoon of the Day

ISABELNET Cartoon of the Day The S&P 500 took a minor tumble of 0.24% last week, confirming the bears’ eternal pessimism. However, bulls are too busy celebrating a 2.55% year-to-date gain, including dividends! Have a…

S&P 500 and Trend Channel

S&P 500 and Trend Channel The S&P 500 has maintained a strong upward trajectory for over two years. Even if the growth rate moderates, the short-, medium-, and long-term trends are still intact, pointing to…

Valuation – Shiller CAPE P/E Ratio

Valuation – Shiller CAPE P/E Ratio While a high CAPE ratio doesn’t necessarily lead to an immediate market correction, it often correlates with lower returns in the future. Image: Topdown Charts

ISABELNET Cartoon of the Day

ISABELNET Cartoon of the Day Unexpectedly, Wall Street’s fiercest rivals, Bull and Bear, declared a ceasefire—not to discuss finance, but to share nachos and watch the Super Bowl together! Who knows? World peace might be…

Oil Price vs. U.S. 10-Year Breakeven Inflation Rate

Oil Price vs. U.S. 10-Year Breakeven Inflation Rate Since the 2008 global financial crisis, U.S. breakeven inflation has closely tracked crude oil prices, reflecting the significant impact of oil price fluctuations on inflation expectations and…