Performance of MSCI ACWI Around Global Health Emergencies
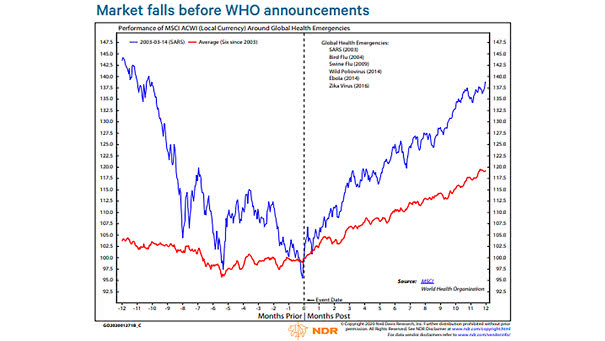
Performance of MSCI ACWI Around Global Health Emergencies Historically, the global stock market has bottomed, when the WHO has declared a global health emergency. Image: Ned Davis Research
Performance of MSCI ACWI Around Global Health Emergencies Historically, the global stock market has bottomed, when the WHO has declared a global health emergency. Image: Ned Davis Research
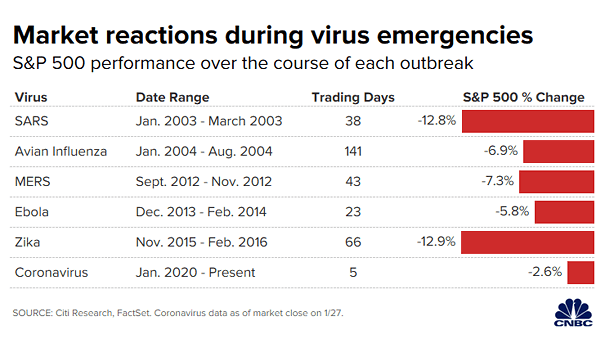
S&P 500 Performance During Virus Emergencies Past virus scares shows that the S&P 500 has lost 6% to 13% over different lengths of time. Image: CNBC
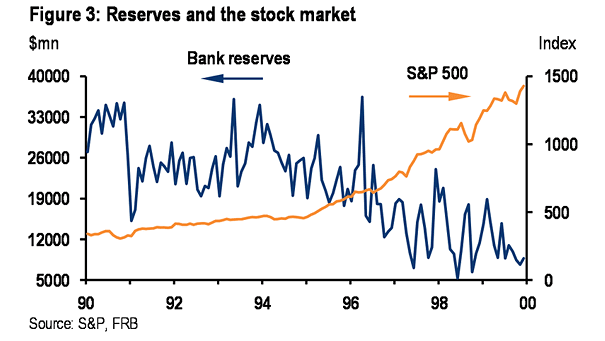
Bank Reserves and S&P 500 J.P. Morgan suggests that Fed-injected liquidity is not the reason for the rise in the valuation of risk assets. Image: J.P. Morgan
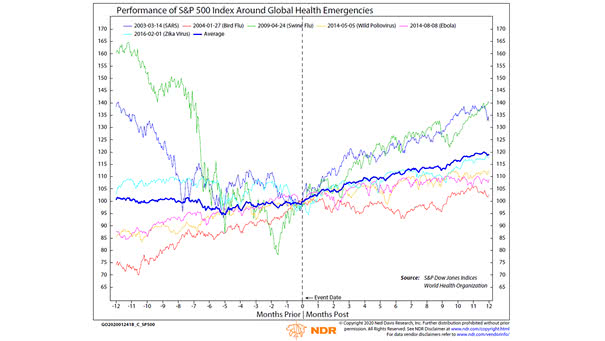
Performance of S&P 500 Index Around Global Health Emergencies Historically, market reactions to previous major health scares have shown short-term volatility, but no disruptions over an extended period of time. Image: Ned Davis Research
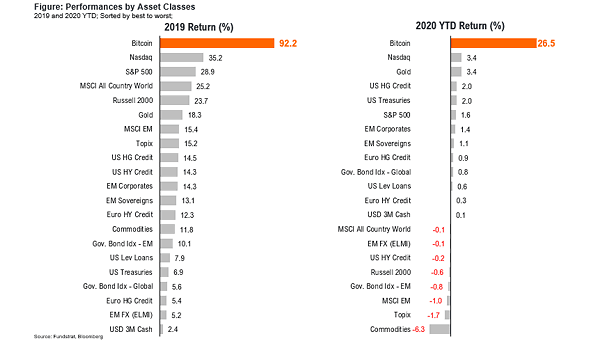
Bitcoin, Gold and Performances by Asset Classes Bitcoin is the best performing asset class YTD, even better than gold known as the “safe haven” asset. Image: Fundstrat Global Advisors, LLC
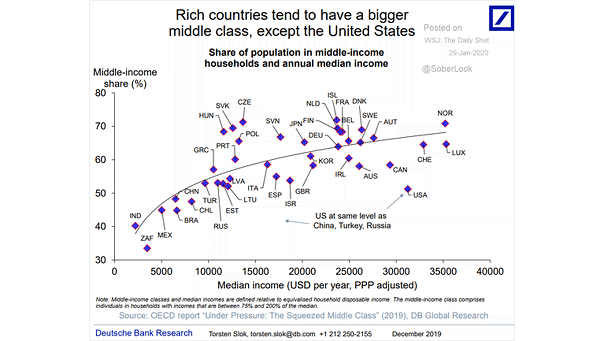
Inequality – Share of Population in Middle-Income Households and Annual Median Income The middle class is shrinking rapidly in the United States. It’s at the same level as China, Turkey and Russia. Image: Deutsche Bank…
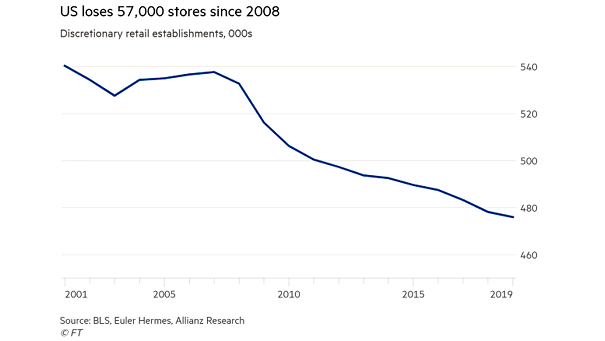
Discretionary Retail Establishments in the United States Chart suggesting that the rise of ecommerce is having a real impact on retail stores. Image: Financial Times
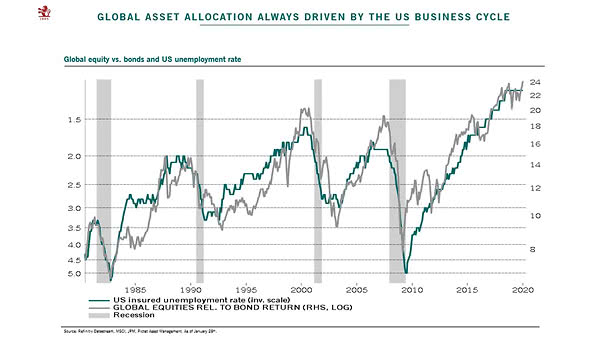
U.S. Business Cycle – Global Equity vs. Bonds and U.S. Unemployment Rate Chart suggesting that U.S. growth has peaked. Image: Pictet Asset Management
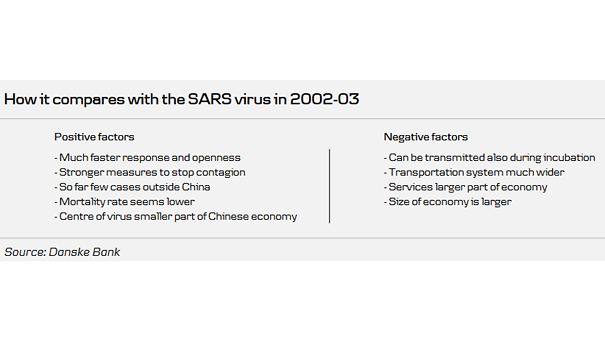
China – How the coronavirus compares with the SARS virus in 2002-2003? This comparison reveals both positive and negative factors. Image: Danske Research
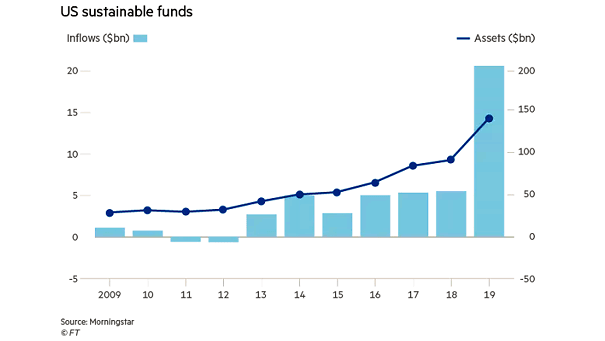
Flows into U.S. Sustainable Funds Chart showing that more money flows into U.S. sustainable investment funds. Image: Financial Times
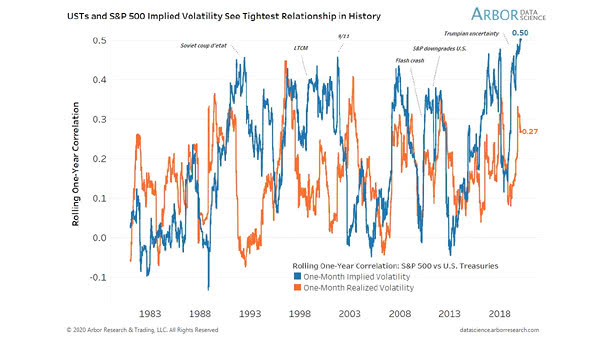
Correlation Between VIX and MOVE The rolling one-year correlation between VIX and MOVE is at the highest level on record. Image: Arbor Research & Trading LLC