Vanguard and U.S. Mutual Funds
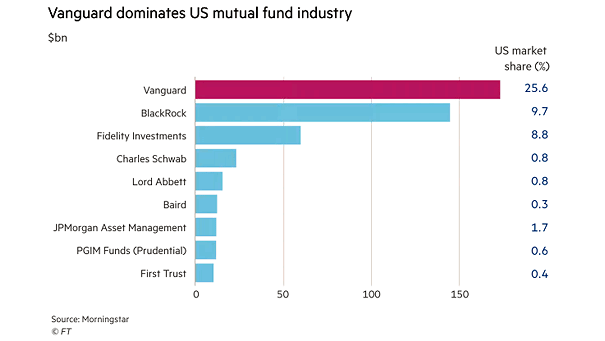
Vanguard and U.S. Mutual Funds Is Vanguard getting too big as a firm? What about its impact on corporate America? Image: Financial Times
Vanguard and U.S. Mutual Funds Is Vanguard getting too big as a firm? What about its impact on corporate America? Image: Financial Times
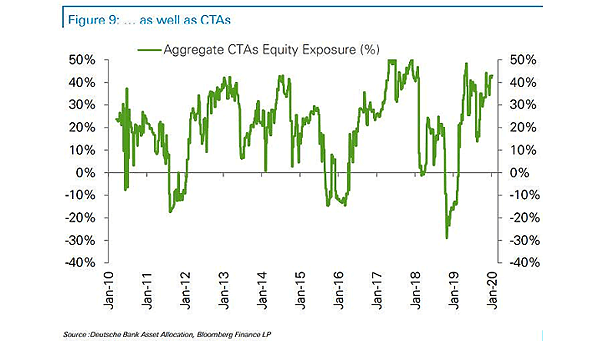
Aggregate CTAs Equity Exposure CTAs equity exposure also remains at a high level. Image: Deutsche Bank Asset Allocation
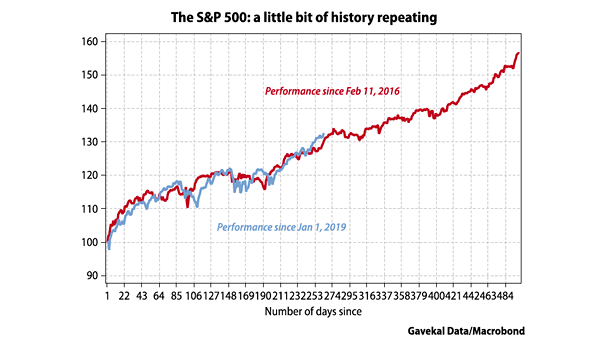
S&P 500 – Performance since 2016 vs. Performance since 2019 The U.S. stock market is on fire. Will history repeat itself? Image: Gavekal, Macrobond
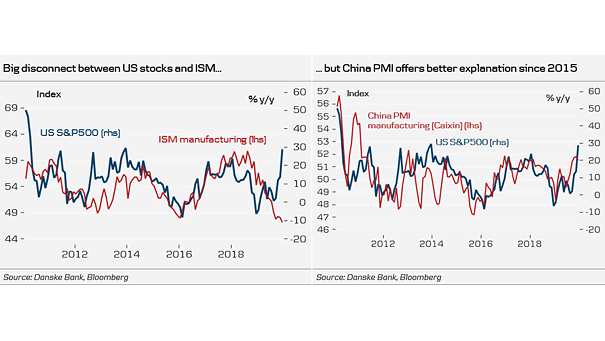
S&P 500 and Caixin China Manufacturing PMI This chart suggests that the relationship between the S&P 500 and the Chinese Manufacturing PMI offers a better explanation since 2015. Image: Danske Bank Research
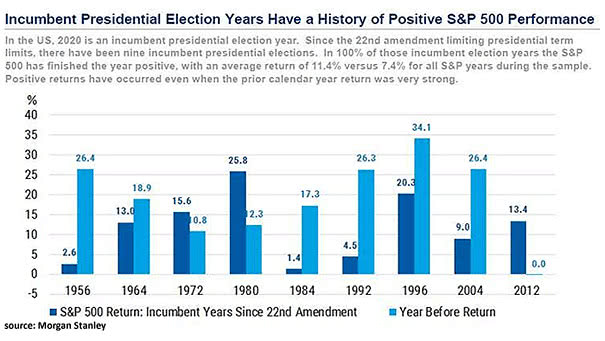
Incumbent Presidential Election Years Since 22nd Amendment Incumbent presidential election years have traditionally been good for equities, with an average return of 11.4% since 22nd amendment. Image: Morgan Stanley Research
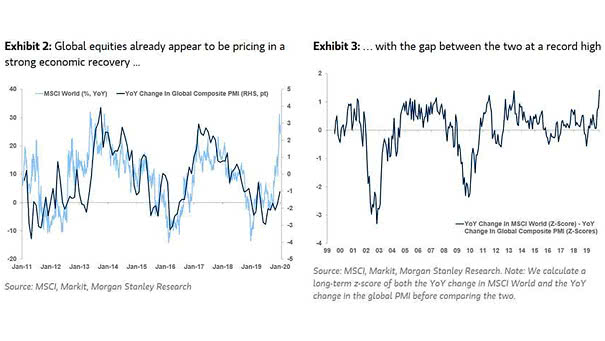
MSCI World vs. Global Composite PMI Global stock markets are very optimistic, as soft and hard indicators suggest that the global slowdown may have bottomed out. Image: Morgan Stanley Research
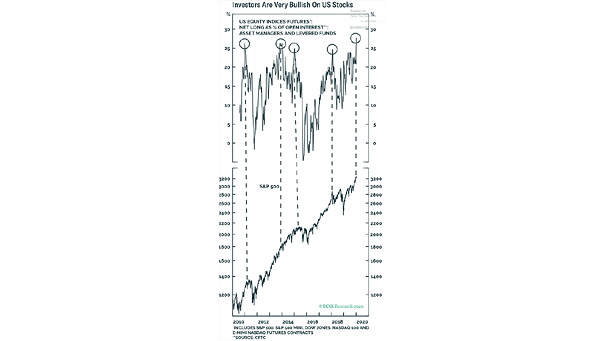
U.S. Equity Indices Futures The U.S. stock market is on fire. Investors have grown extremely bullish. Image: BCA Research
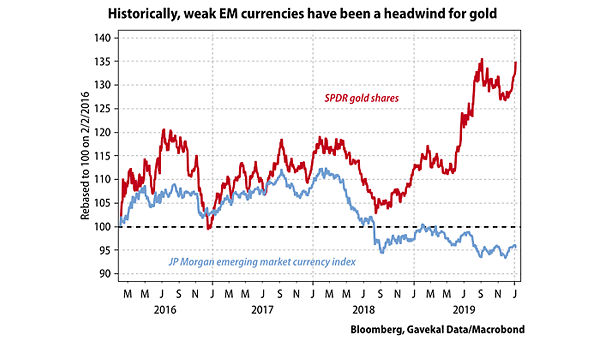
Gold and Emerging Market Currency Index Historically, a weak U.S. dollar tends to be good for gold and emerging markets. Image: Gavekal, Macrobond
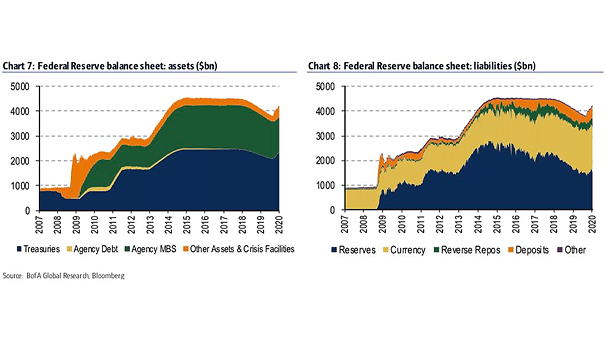
Federal Reserve Balance Sheet: Assets and Liabilities This chart shows the total assets and liabilities of the Federal Reserve. According to the NY Fed, the Fed’s balance sheet could be between $3.8 trillion and $4.7…
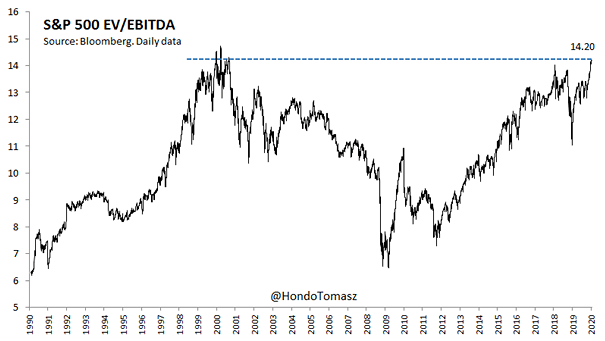
Valuation – S&P 500 EV/EBITDA The EV/EBITDA of the S&P 500 suggests that stocks are as expensive as they were during the Internet bubble. Image: Tomasz Hońdo
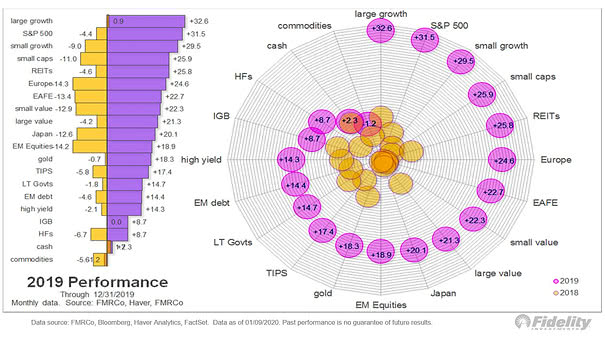
2019 Market Performance Compared to 2018 Large growth, S&P 500, small growth, small caps and REITs perform best in 2019. Image: Fidelity Investments