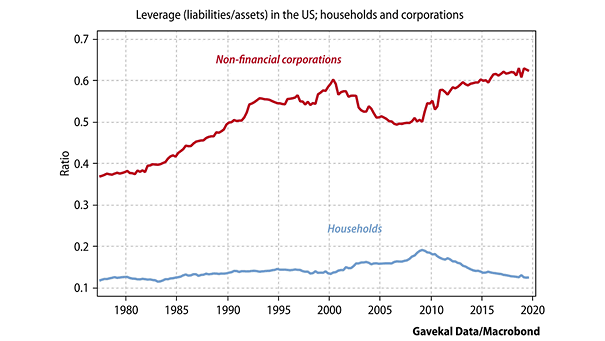
Debt, Demographics and Labor Force Growth

Debt, Demographics and Labor Force Growth The slowdown in the labor force in the U.S., China, Europe and Japan, represents 62% of the world’s GDP and 69% of the equity market capitalization. The labor force…

China: Chinese Debt-to-GDP Ratios by Sector

China: Chinese Debt-to-GDP Ratios by Sector The debt-to-GDP ratio of the non-financial corporate sector accounts for the largest share of China’s debt and declined to 143% of GDP. Image: Pictet Wealth Management

MSCI ACWI and S&P 500 Forward P/E Multiple

MSCI ACWI and S&P 500 Forward P/E Multiple This year, the forward P/E multiple for global equities and for the S&P 500 increased by approximately 24%. Historically, multiples contract or remain flat following years of…

S&P 500 Percentage of Up Days by Year

S&P 500 Percentage of Up Days by Year This year, the S&P 500 recorded gains 59.3% of the time. This has been rare since 1928. Image: Bespoke Investment Group

Asset Class and Sharpe Ratio Since 1990

Asset Class and Sharpe Ratio Since 1990 The sharpe ratio is a measure of risk-adjusted return. This year, major asset classes have a positive and high sharpe ratio. Image: Arbor Research & Trading LLC Click…

Fed Funds vs. Private Sector Wage Growth

Fed Funds vs. Private Sector Wage Growth The last three U.S. economic expansions ended with the Federal Reserve hiking to curb wage growth, but not this time. That’s quite bullish. Image: BofA Global Research

60/40 Portfolio Yearly Total Return

60/40 Portfolio Yearly Total Return The 60/40 portfolio gains more than 22% this year and is on pace for its best year since 1997. Image: Bianco Research Click the Image to Enlarge  

U.S. Wage Growth and Business Cycles

U.S. Wage Growth and Business Cycles Despite the U.S. economic expansion is now the longest in history, wage growth has been much slower during this business cycle than in previous cycles. Image: CNBC