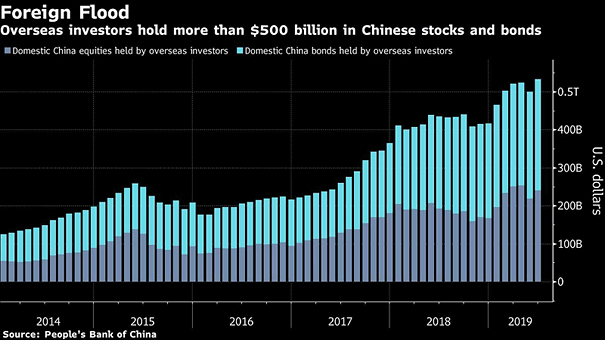
Domestic China Equities and Bonds Held by Overseas Investors
Domestic China Equities and Bonds Held by Overseas Investors Foreign holdings of Chinese equities rose to a record high this year, despite the U.S.-China trade war. Image: Bloomberg
Domestic China Equities and Bonds Held by Overseas Investors Foreign holdings of Chinese equities rose to a record high this year, despite the U.S.-China trade war. Image: Bloomberg
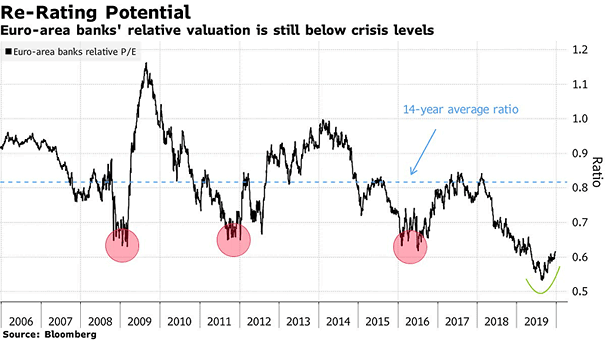
Euro Area Banks Relative Valuation The relative valuation of euro area banks is still below the levels of the financial crisis, due to falling interest rates and negative rates in Europe. Image: Bloomberg
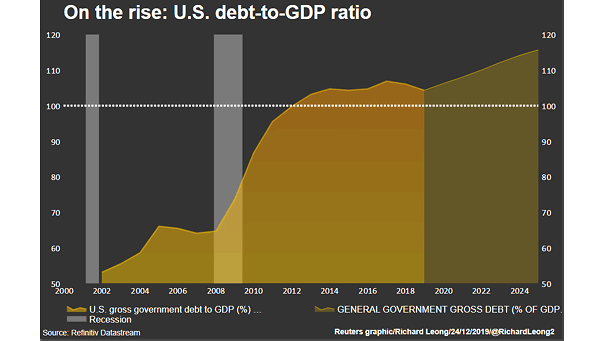
U.S. Gross Government Debt to GDP U.S. government debt is expected to grow and could increase the likelihood of a fiscal crisis in the future. Image: Reuters
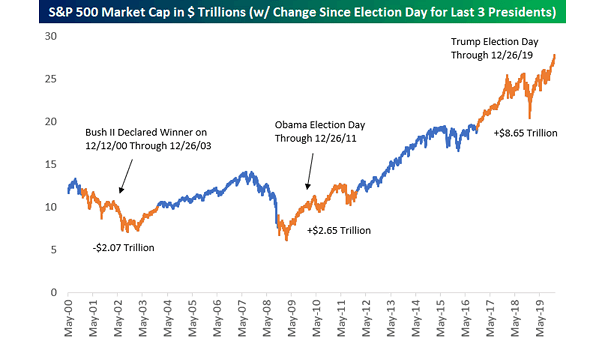
S&P 500 Market Capitalization Since Election Day for Three U.S. Presidents The S&P 500 market cap has increased by $8.65 trillion since the election of President Donald Trump. Image: Bespoke Investment Group
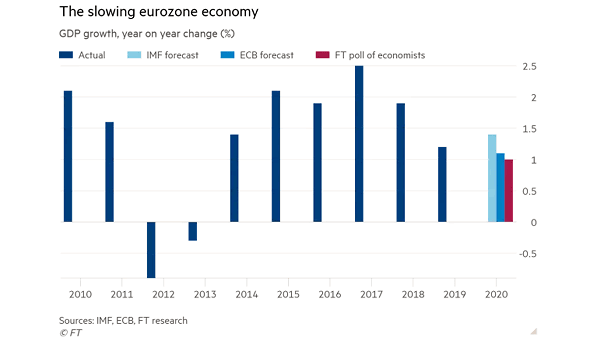
Euro Area GDP Growth According to the forecasts of 34 economists, GDP growth in the euro area is expected to dip below 1% on average in 2020. Image: Financial Times
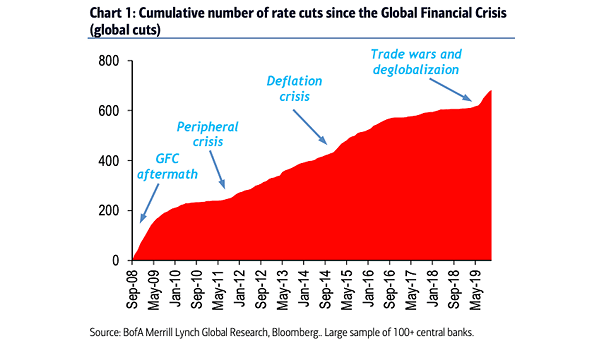
Cumulative Number of Global Rate Cuts since the Global Financial Crisis This chart puts into perspective the cumulative number of global rate cuts since the Global Financial Crisis. In 2019, central banks in OECD countries…
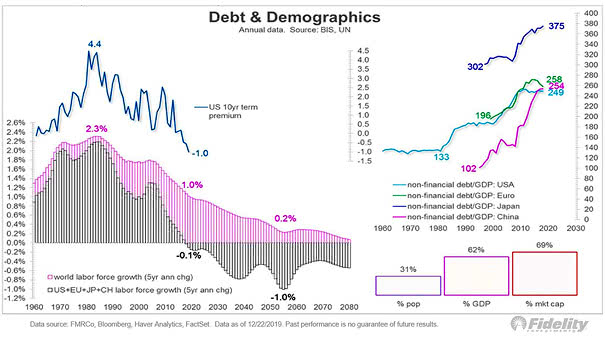
Debt, Demographics and Labor Force Growth The slowdown in the labor force in the U.S., China, Europe and Japan, represents 62% of the world’s GDP and 69% of the equity market capitalization. The labor force…
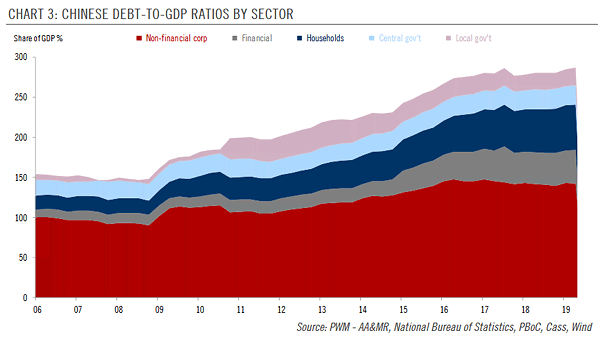
China: Chinese Debt-to-GDP Ratios by Sector The debt-to-GDP ratio of the non-financial corporate sector accounts for the largest share of China’s debt and declined to 143% of GDP. Image: Pictet Wealth Management
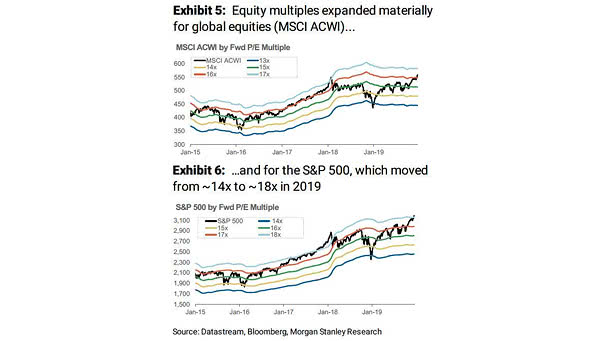
MSCI ACWI and S&P 500 Forward P/E Multiple This year, the forward P/E multiple for global equities and for the S&P 500 increased by approximately 24%. Historically, multiples contract or remain flat following years of…
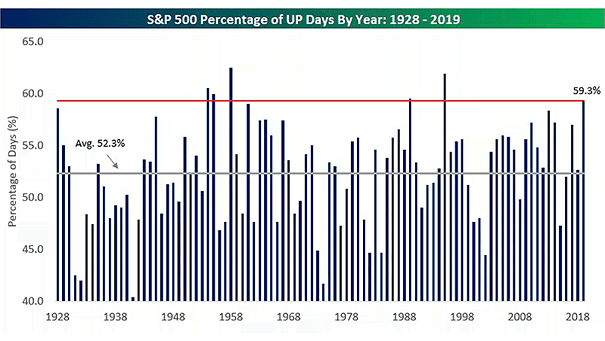
S&P 500 Percentage of Up Days by Year This year, the S&P 500 recorded gains 59.3% of the time. This has been rare since 1928. Image: Bespoke Investment Group
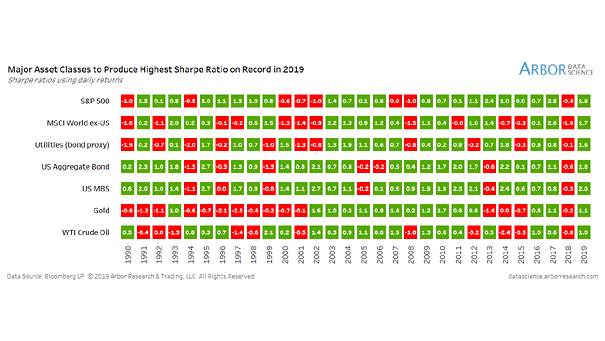
Asset Class and Sharpe Ratio Since 1990 The sharpe ratio is a measure of risk-adjusted return. This year, major asset classes have a positive and high sharpe ratio. Image: Arbor Research & Trading LLC Click…