U.S. Nonfarm Payroll Growth and Unemployment Rate
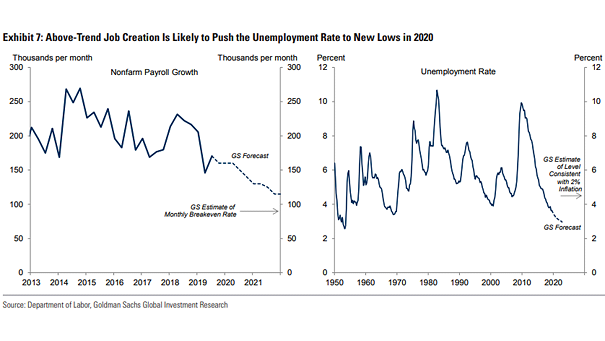
U.S. Nonfarm Payroll Growth and Unemployment Rate Goldman Sachs expects new lows in the U.S. unemployment rate in 2020. Image: Goldman Sachs Global Investment Research
U.S. Nonfarm Payroll Growth and Unemployment Rate Goldman Sachs expects new lows in the U.S. unemployment rate in 2020. Image: Goldman Sachs Global Investment Research
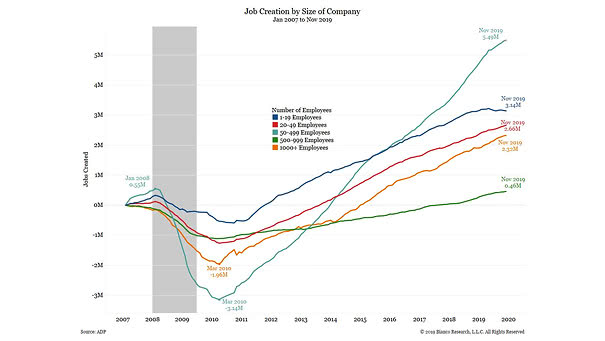
Job Creation by Size of Company in the U.S. Large companies are becoming less important, when it comes to job creation in the United States. Image: Bianco Research
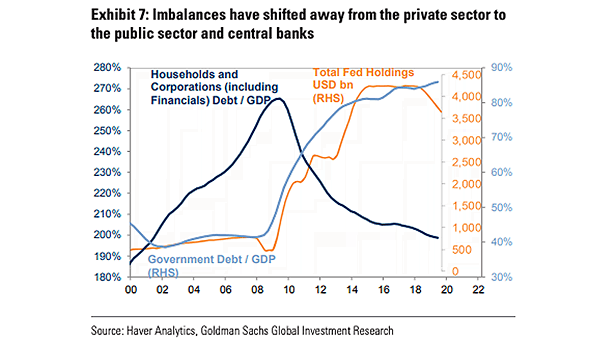
Households and Corporations Debt to GDP and Total Fed Holdings Since the Great Financial Crisis, the private sector has de-leveraged, while the Fed’s balance sheet has risen sharply. Image: Goldman Sachs Global Investment Research
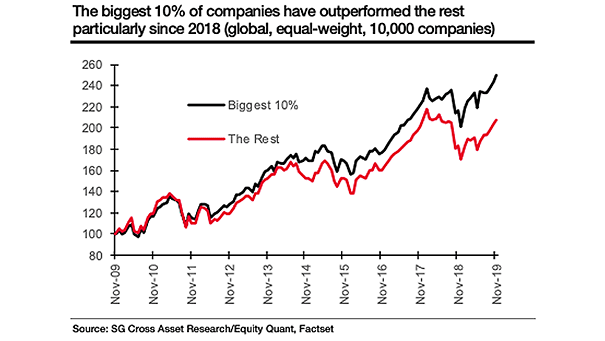
Outperformance of the Biggest 10% Companies vs. Rest of the Market Chart showing that the biggest 10% of companies have significantly outperformed the rest of the market. Image: Societe Generale Cross Asset Research
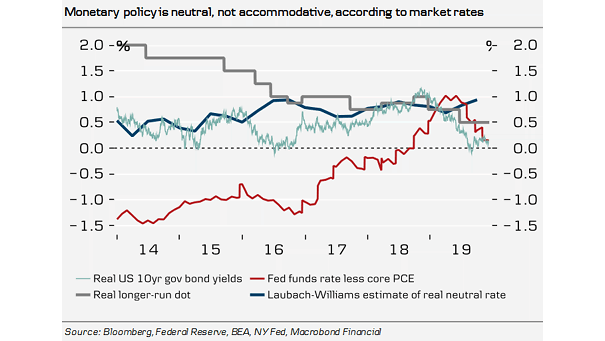
Monetary Policy and Fed Funds Rate According to market rates, monetary policy is more neutral than accommodative. Image: Danske Research
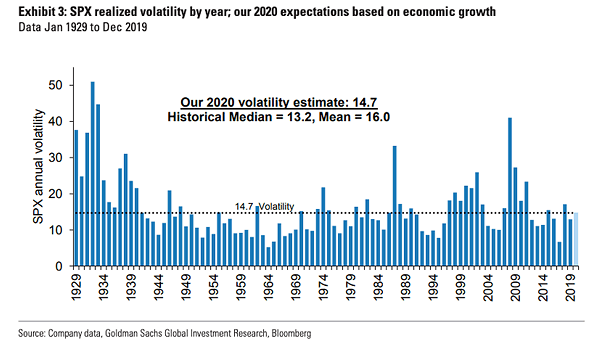
S&P 500 Realized Volatility by Year 2020 volatility estimate of 14.7 is above the median, but below the mean (data from January 1929 to December 2019). Image: Goldman Sachs Global Investment Research
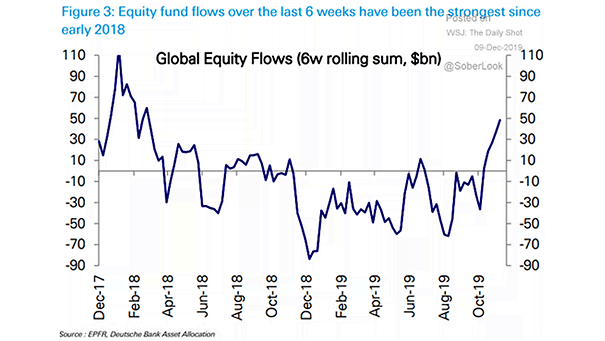
Global Equity Flows A lot of investors are chasing returns, driving stocks higher. Image: Deutsche Bank Asset Allocation
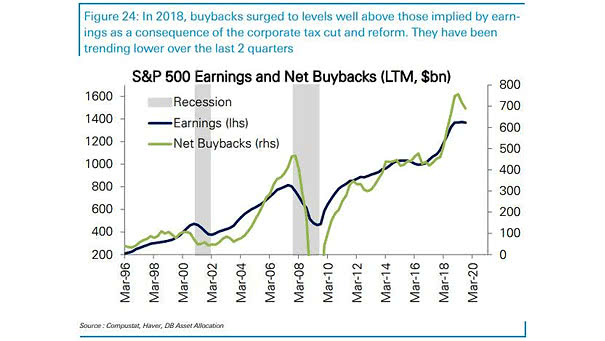
S&P 500 Earnings and Net Buybacks Buybacks have been trending lower over the last two quarters. Deutsche Bank expects buybacks to slow to $625bn in 2020. Image: Deutsche Bank Asset Allocation
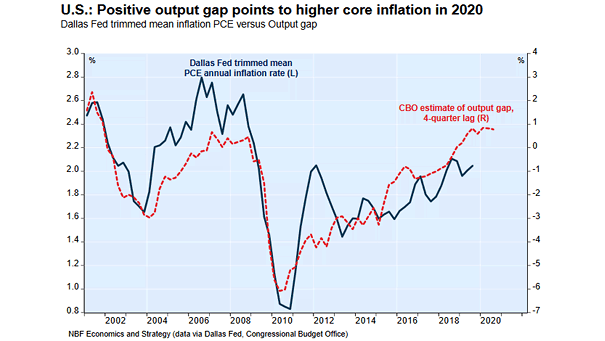
PCE Inflation vs. Output Gap (Leading Indicator) Positive output gap suggests higher core inflation next year. Image: NBF Economics and Strategy
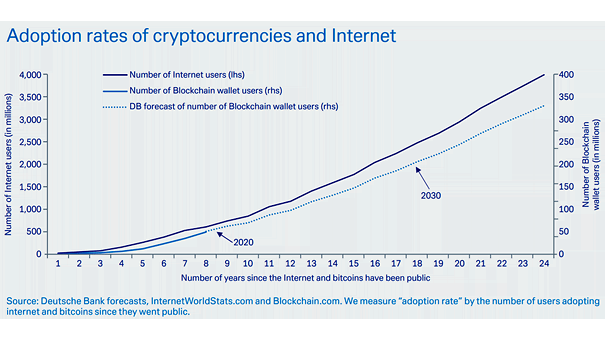
Adoption Rates of Cryptocurrencies and Internet Deutsche Bank predicts cryptocurrencies could eventually replace fiat money over the next decade. Image: Deutsche Bank Forecasts
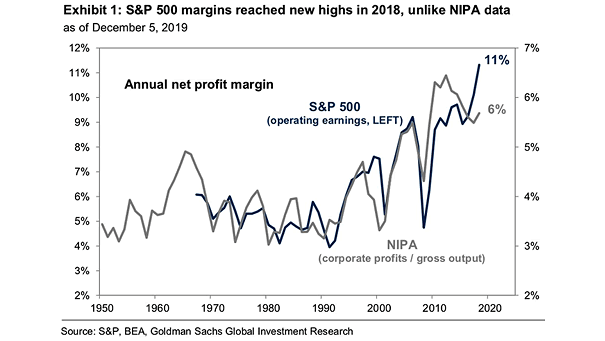
S&P 500 Operating Earnings and NIPA Corporate Profits Goldman Sachs expects S&P 500 margins to rise slightly in 2020. Image: Goldman Sachs Global Investment Research