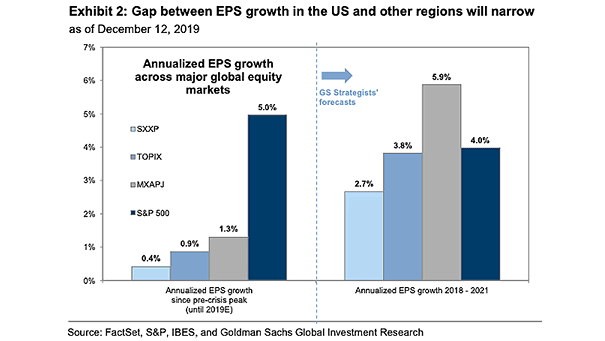
Annualized EPS Growth Across Major Global Equity Markets
Annualized EPS Growth Across Major Global Equity Markets Goldman Sachs expects that EPS will modestly accelerate to 6% in the U.S. next year. Image: Goldman Sachs Global Investment Research
Annualized EPS Growth Across Major Global Equity Markets Goldman Sachs expects that EPS will modestly accelerate to 6% in the U.S. next year. Image: Goldman Sachs Global Investment Research
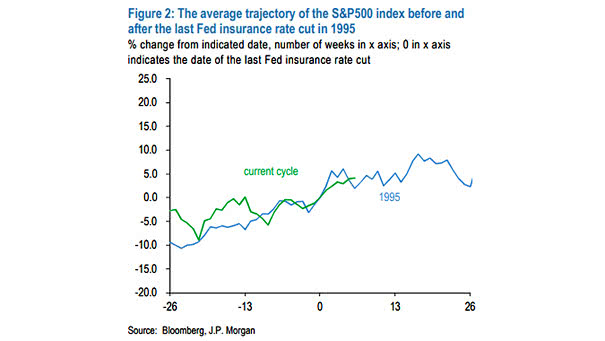
S&P 500 Index and Fed Insurance Rate Cut Chart suggesting around 5% upside for the S&P 500 Index through mid-2020. Image: J.P. Morgan
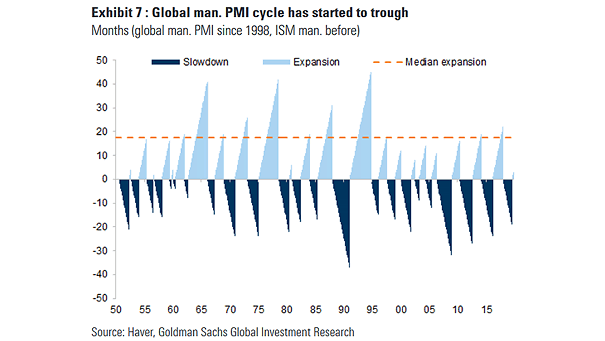
Global Manufacturing PMI Cycle Chart suggesting that the worst is over for global manufacturing PMI. Image: Goldman Sachs Global Investment Research
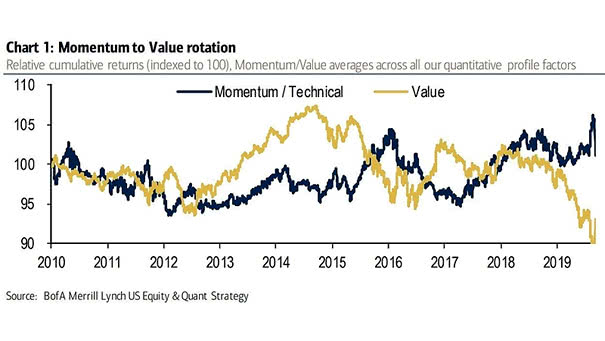
Momentum to Value Rotation The rotation into value suggests a rebound in global economic growth, not a recession. Image: BofA Merrill Lynch US Equity & US Quant Strategy
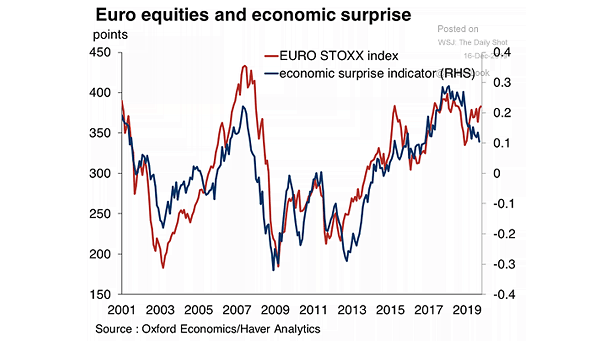
Correlation – Euro Equities and Economic Surprise The correlation between euro equities and economic surprise has diverged recently. Image: Oxford Economics
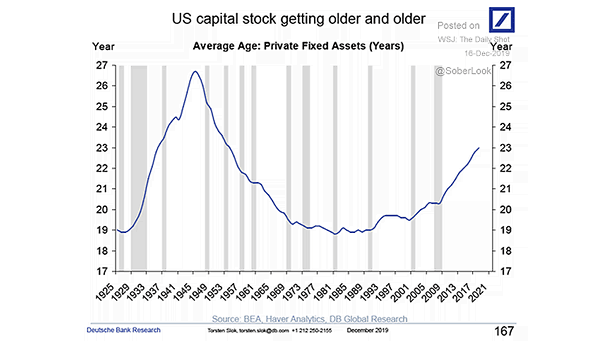
Average Age of U.S. Private Fixed Assets Since the Great Financial Crisis, America’s equipment is getting older. Companies have been reluctant to invest and that’s not good news for the U.S. economy. Image: Deutsche Bank…
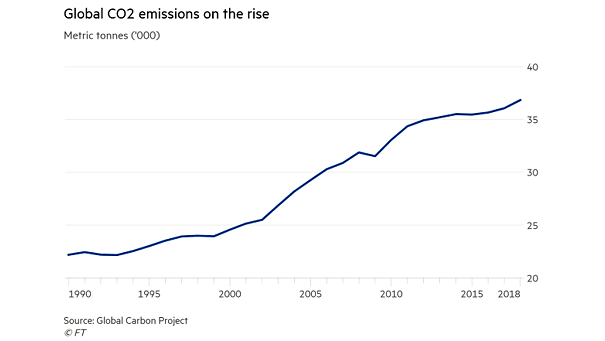
Global CO2 Emissions Worried about climate change? Global carbon dioxide emissions hit a record this year. Image: Financial Times
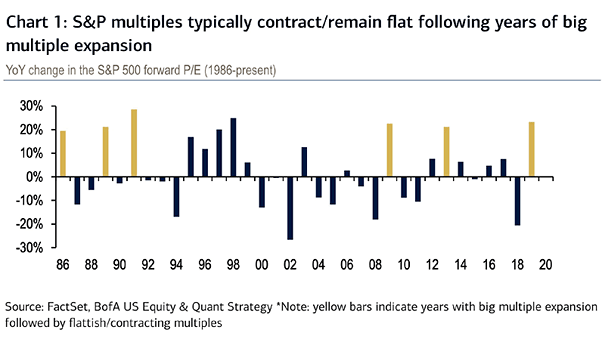
Multiple Expansion – Year-Over-Year Change in the S&P 500 Forward P/E Since the beginning of the year, the multiple expansion explains the S&P 500 return. Historically, S&P multiples contract or remain flat following years of…
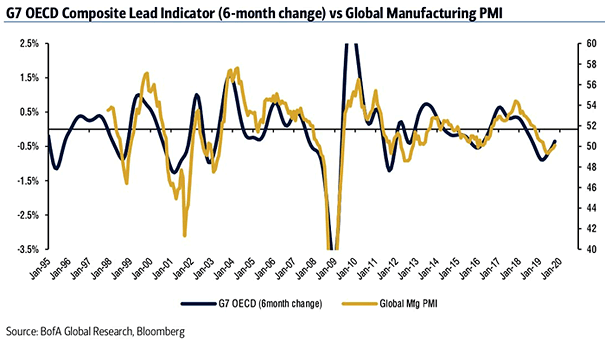
G7 OECD Composite Lead Indicator and Global Manufacturing PMI This chart also suggests a pick-up in the global manufacturing PMI, after having been in contraction territory. Image: BofA Global Research
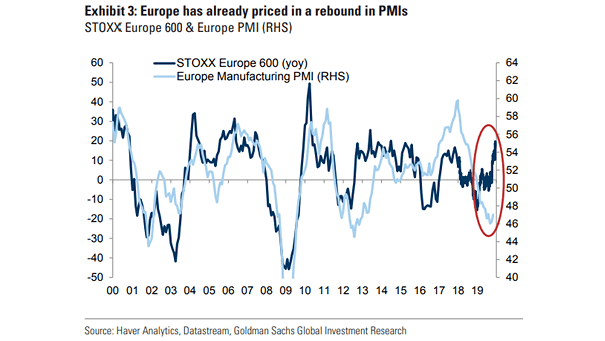
Stoxx Europe 600 and Europe Manufacturing PMI Is the Europe manufacturing PMI rebound in the cards? European stock markets remain bullish. Image: Goldman Sachs Global Investment Research
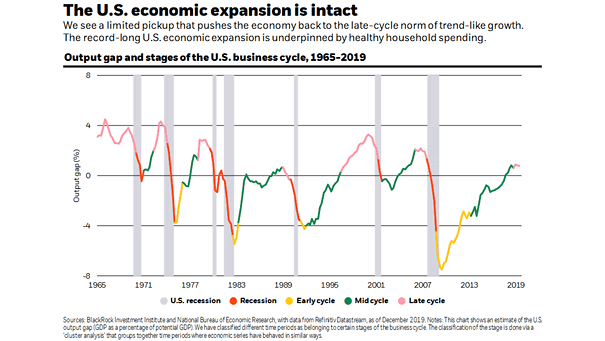
Output Gap and Stages of the U.S. Business Cycle Despite gloomy headlines, this chart suggests that the U.S. economic expansion is still intact. Image: BlackRock Investment Institute