U.S. Dollar Cycles
U.S. Dollar Cycles U.S. dollar cycles are persistent and are counted in years. In the absence of a recession in the U.S. in 2020, the strength of the U.S. dollar should continue for some time.…
Inequality – Intergenerational Earnings Elasticity and Gini Coefficient Chart suggesting that social mobility cannot be achieved without greater equality (R² = 0.5) Image: Financial Times
S&P 500 Index vs. MSCI EAFE Index Largely due to structural headwinds, international stocks have underperformed U.S. stocks significantly in this bull market, over the last ten years. It could continue next year as well.…
Russell 2000 vs. Russell 1000 and Subsequent 10-Year Annualized Relative Returns Chart suggesting that small caps should outperform large caps over the next 10 years (R² = 0.42). Image: BofA Merrill Lynch US Equity &…
S&P 500 % Above Previous Year’s Peak Is this a blow-off top? The S&P 500 is only 7.6% above the peak from 2018, and below the average of 8.5%. Image: Ryan Detrick, LPL Financial LLC
Length of Economic Expansion and U.S. GDP Growth The current business cycle is the longest and weakest expansion. Image: Barclays Research
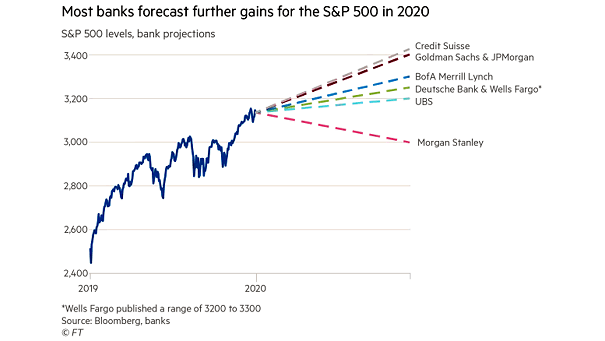
Outlook 2020: S&P 500 Target, GDP Growth Estimate and 10-Year U.S. Treasury Yield LPL expects 1.75% U.S. GDP growth in 2020. The S&P 500 Index fair value target range is 3,200–3,300 by year-end 2020, and…
Projected Changes in Central Bank Balance Sheets Central bank balance sheets are expected to continue to grow in 2020. Image: BofA Merrill Lynch Global Research
Major Economies Central Banks Total Assets and MSCI ACWI Chart suggesting that central bank stimulus would support financial markets in 2020 (R = 0.95 since 2009). Image: BofA Merrill Lynch Global Research
Median Age of All U.S. Homebuyers Housing affordability is difficult today. The median age of all U.S. homebuyers hit a record, rising from 31 years in 1981 to 47 years in 2019. Image: Deutsche Bank…
Reserve Bank Credit, Treasury Securities and MBS This chart shows how Reserve Bank credit has increased, as the Fed has continued to add treasury securities to its balance sheet. Image: Wells Fargo Investment Institute