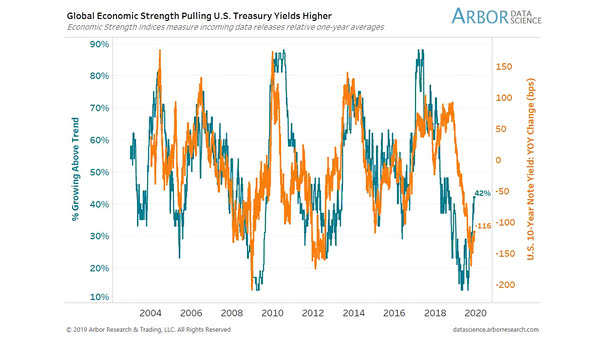
Global Economic Strength and U.S. 10-Year Note Yield
Global Economic Strength and U.S. 10-Year Note Yield Chart suggesting that global economic strength explains the U.S. 10-year note yield. Image: Arbor Research & Trading LLC
Global Economic Strength and U.S. 10-Year Note Yield Chart suggesting that global economic strength explains the U.S. 10-year note yield. Image: Arbor Research & Trading LLC
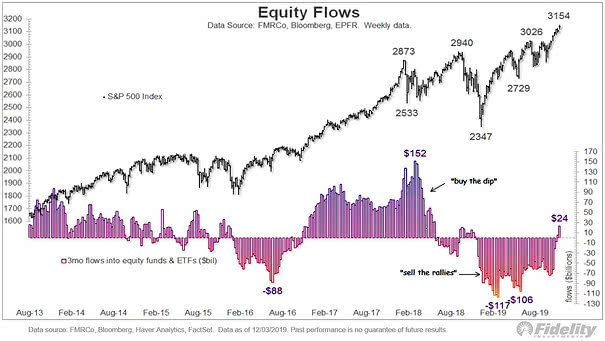
U.S. Equity Flows Chart showing that money is once again flowing slightly into equity funds and ETFs. Image: Fidelity Investments
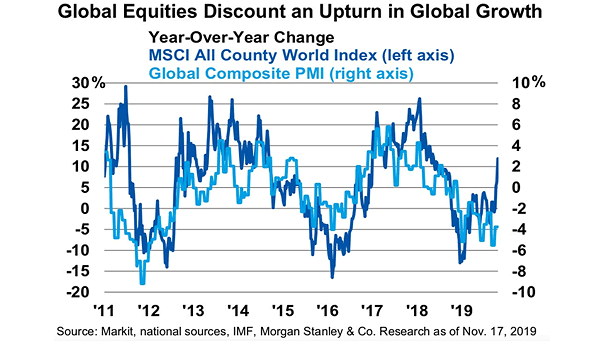
MSCI ACWI and Global Composite PMI Chart suggesting that global equities expect a pickup in global growth, as policy stimulus takes effect. Image: Morgan Stanley Research

Valuation – Distribution of S&P 500 P/E since 1935 On a P/E basis, the S&P 500 is not cheap. The S&P 500 P/E has been higher only about 10% of the time since 1935. Image:…
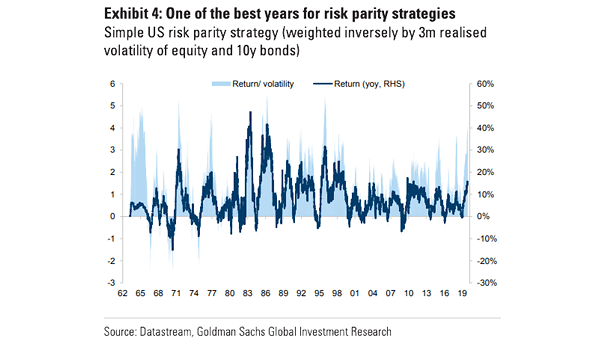
Simple U.S. Risk Parity Strategy Risk parity strategies performed very well this year. Image: Goldman Sachs Global Investment Research
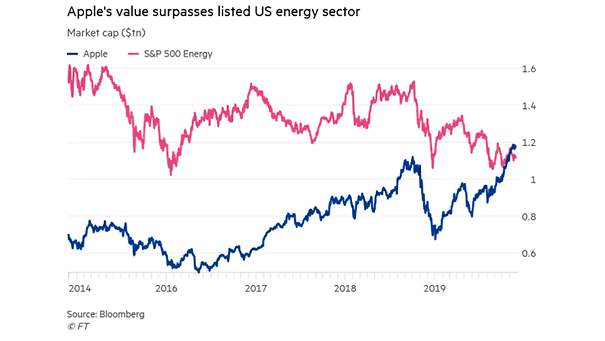
Valuation – Apple Market Capitalization and S&P 500 Energy Apple is now worth more than the U.S. energy sector. Image: Financial Times
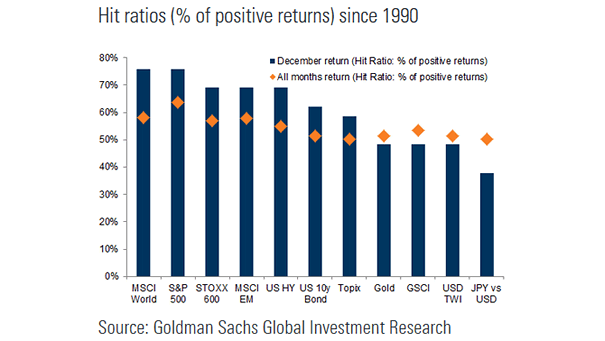
December Return vs. All Months Return Historically, the percentage of positive returns in December has been above average for stocks and bonds since 1990. Image: Goldman Sachs Global Investment Research

S&P 500 Performance 12-Months After ISM Manufacturing Index Below 50 for Four Months Since 1950, the S&P 500 has rallied 12-months later, 80% of the time, after the ISM Manufacturing Index was below 50 for…
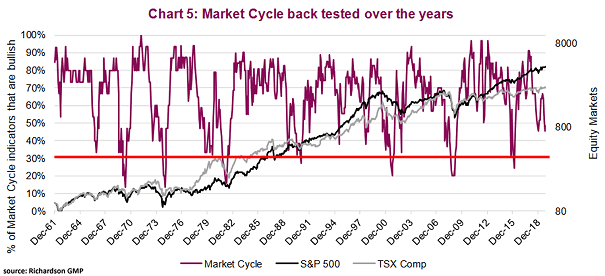
Market Cycle Back Tested over the Years Chart suggesting that the end of a bull market often occurs when the percentage signals that are bullish fall to 30% or below. Image: Richardson Wealth
Tracking Developed Markets Inflation More developed markets are missing their inflation goals. Image: Macrobond Financial
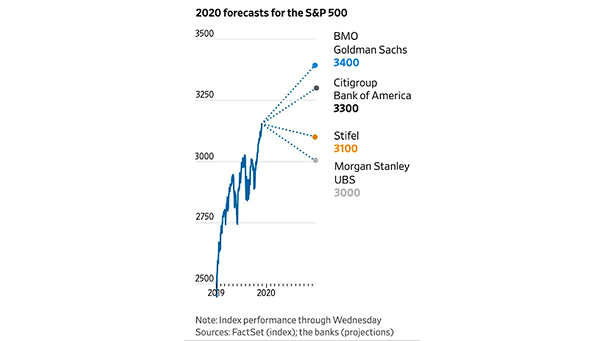
2020 Forecasts for the S&P 500 Analysts are forecasting losses or moderate gains for the S&P 500 in 2020. Image: The Wall Street Journal