Long-Term U.S. Dollar Cycles
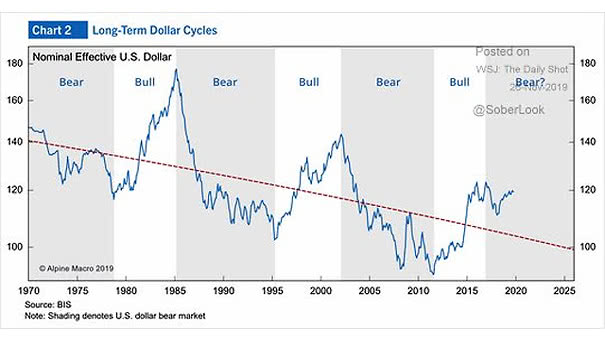
Long-Term U.S. Dollar Cycles This chart shows bear and bull cycles in the U.S. dollar. Will the U.S. dollar enter a bear market? Image: Alpine Macro
Long-Term U.S. Dollar Cycles This chart shows bear and bull cycles in the U.S. dollar. Will the U.S. dollar enter a bear market? Image: Alpine Macro
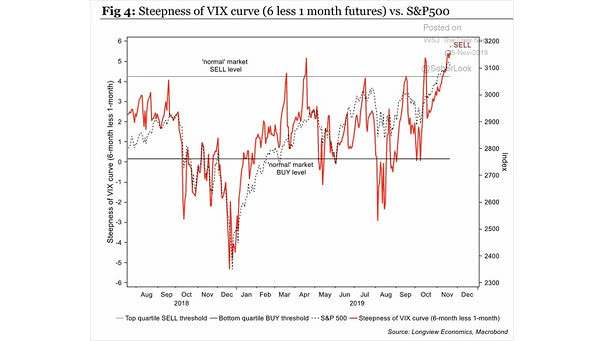
Steepness of VIX Curve vs. S&P 500 This chart suggests a warning sign for the S&P 500. Image: Longview Economics
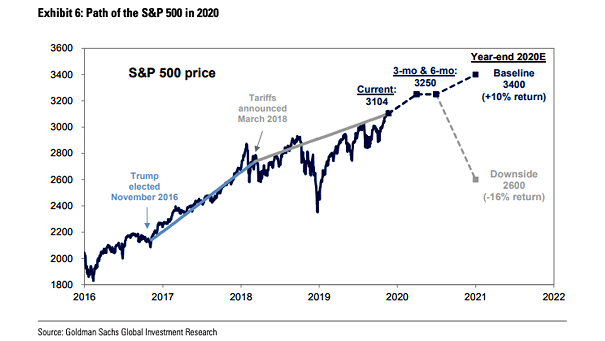
S&P 500 Forecast for 2020 Goldman Sachs forecasts a price-target for the S&P 500 at 3400 by year-end 2020, and a downside scenario at 2600 depending on tariffs and the US election result. Image: Goldman…
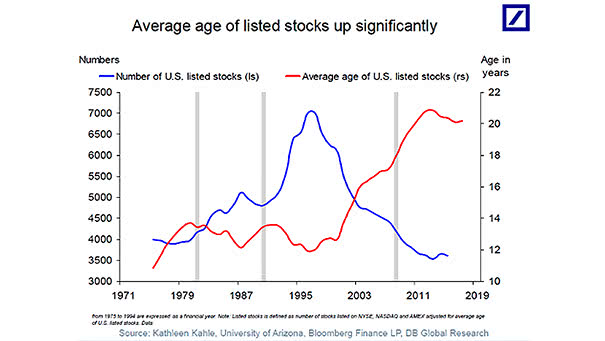
Number of U.S. Listed Stocks and Average Age of U.S. Listed Stocks The U.S. stock market is shrinking. The number of firms listed on U.S. stock exchanges has fallen by nearly 50% since 1996. Image:…
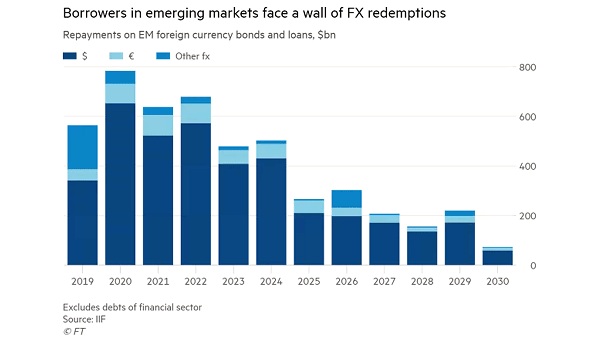
U.S. Dollar Debt in Emerging Markets This chart shows the wall of dollar debt in emerging markets over the next decade. Image: Financial Times
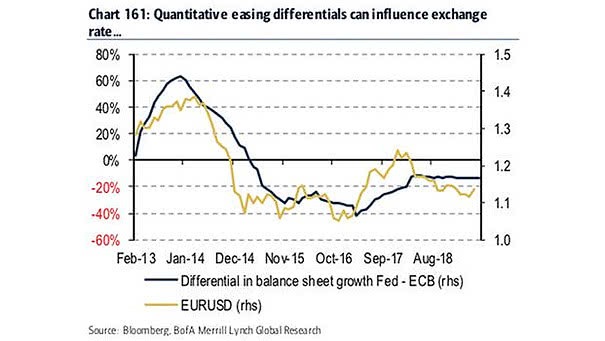
EUR/USD and Differential in Balance Sheet Growth Fed – ECB Chart suggesting that differentials in balance sheet growth between the Fed and the ECB have pushed the U.S. dollar higher. Image: BofA Merrill Lynch Global…
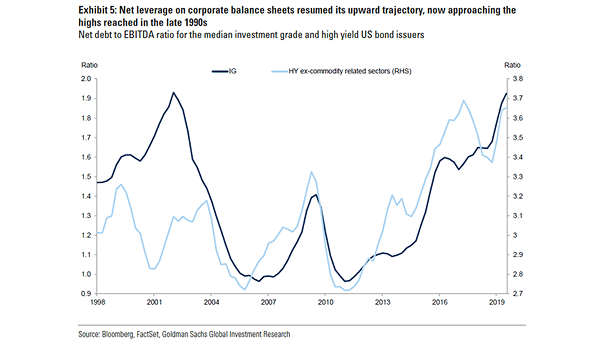
U.S. Corporate Leverage U.S. corporate leverage is high and close to its previous peak on a net debt to EBITDA. Image: Goldman Sachs Global Investment Research
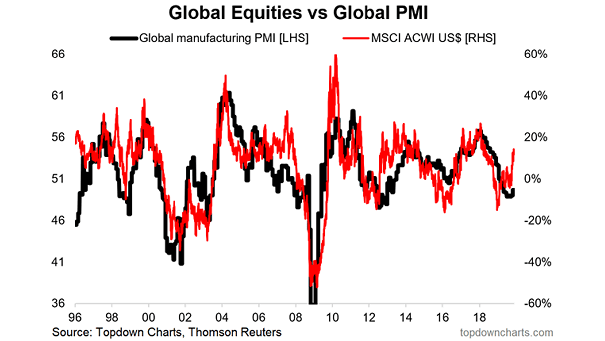
Global Equities vs. Global Manufacturing PMI Chart suggesting that market participants expect global manufacturing PMI to rebound strongly. Image: Topdown Charts
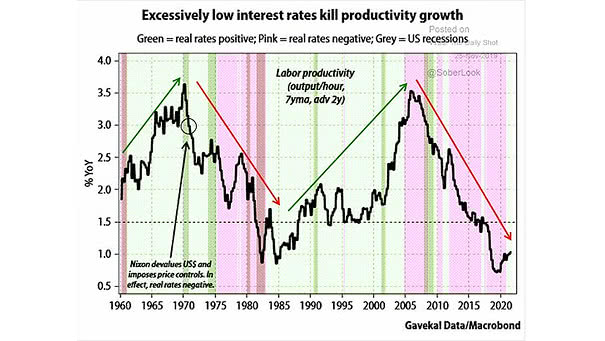
U.S. Labor Productivity and Real Interest Rates Chart suggesting that low real interest rates have a major impact on U.S. labor productivity growth Image: Gavekal, Macrobond
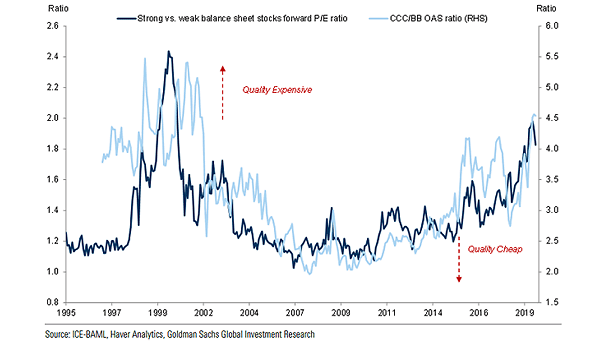
Strong vs. Weak Balance Sheet Stocks Forward P/E Ratio and CCC/BB OAS Ratio Quality in U.S. credit and equity markets is very expensive. Image: Goldman Sachs Global Investment Research
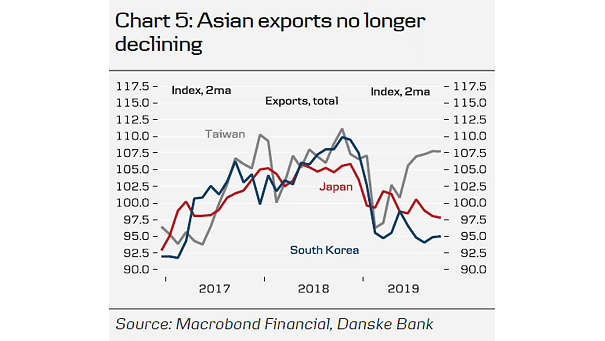
Asian Exports There is a glimmer of hope of a recovery in Asian exports. The free fall in Japan, Taiwan and South Korea exports in early 2019 has stopped. Image: Danske Bank