STOXX Europe 600 EPS Revisions
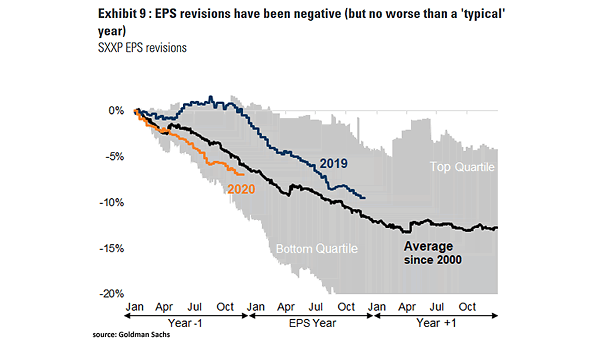
STOXX Europe 600 EPS Revisions This year, SXXP EPS revisions have not been worse than a typical year. Image: Goldman Sachs Global Investment Research
STOXX Europe 600 EPS Revisions This year, SXXP EPS revisions have not been worse than a typical year. Image: Goldman Sachs Global Investment Research
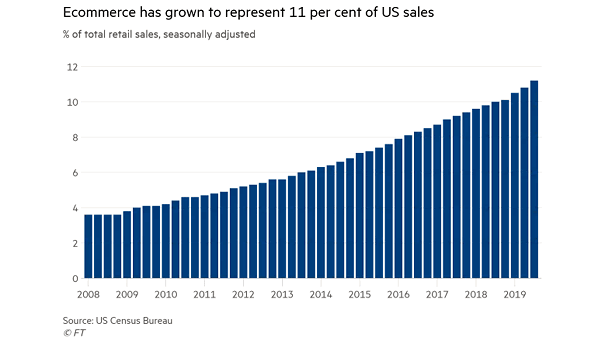
Ecommerce as a Percentage of Total Retail Sales in the U.S. U.S. retail e-commerce sales now account for 11 percent of total sales. Image: Financial Times
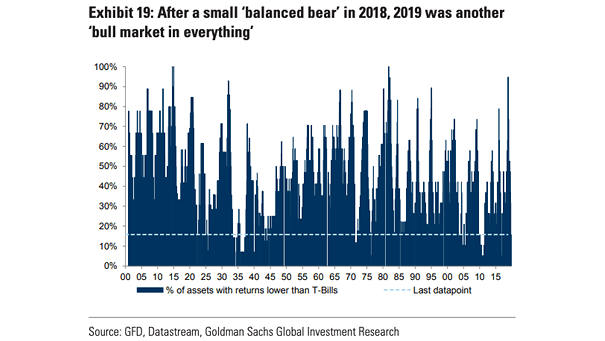
Bull Market: Percentage of Assets With Returns Lower Than T-Bills 2019 was a ‘bull market in everything’. Should investors be worried? Image: Goldman Sachs Global Investment Research
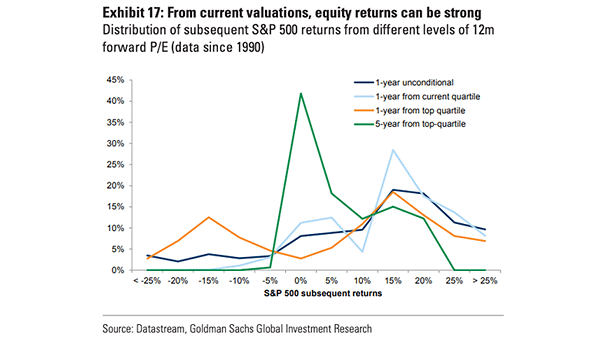
Distribution of Subsequent S&P 500 Returns From Different Levels of 12M Forward P/E Chart suggesting that equity returns can be strong, even though U.S. equities are currently expensive. Image: Goldman Sachs Global Investment Research
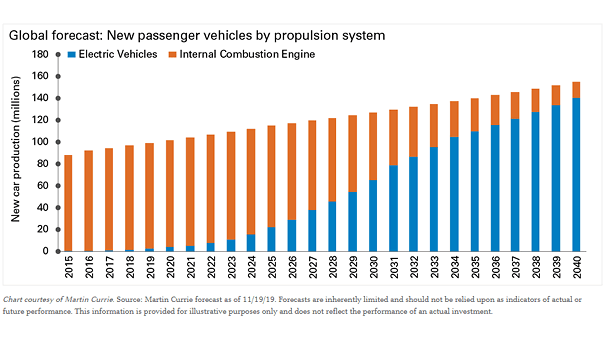
Global Forecast: Electric Vehicles vs. Internal Combustion Engine Chart suggesting that electrical vehicles could account for more than 50% of global new car production within 10 years. Image: Legg Mason
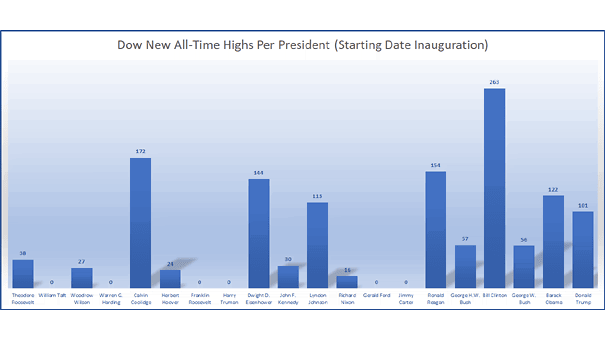
Dow New All-Time Highs Per President Interesting chart showing that Dow new all-time highs have varied significantly under each president. Image: Ryan Detrick, LPL Financial LLC Click the Image to Enlarge
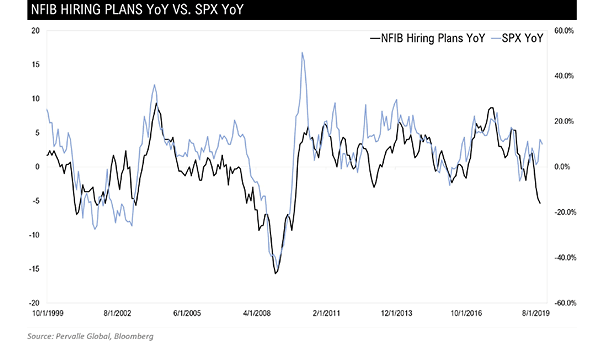
NFIB Hiring Plans vs. S&P 500 Chart showing the correlation between NFIB hiring plans and the S&P 500. Image: Pervalle Global
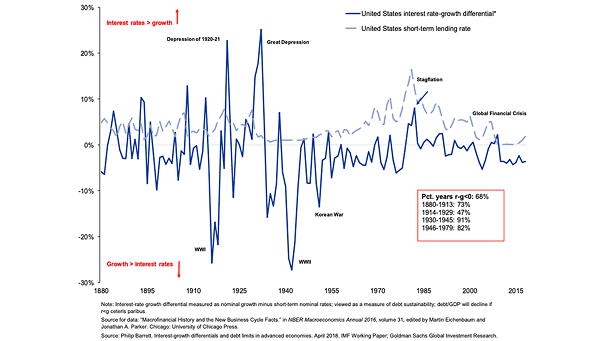
U.S. Interest Rate-Growth Differential and Short-Term Lending Rate Since 1880, U.S. interest rates have been higher than growth 32% of the time. Image: Goldman Sachs Global Investment Research
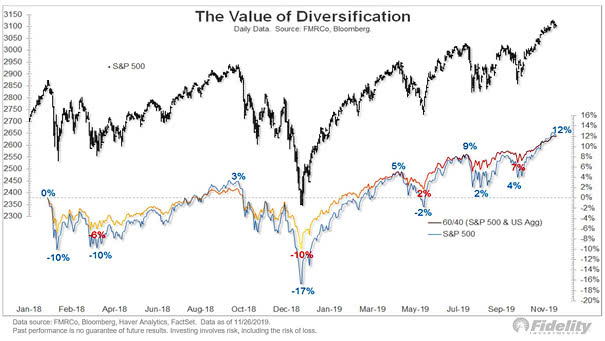
The Value of Diversification – 60/40 Portfolio vs. S&P 500 This chart shows the return and volatility of a 60/40 portfolio vs. S&P 500. Image: Fidelity Investments
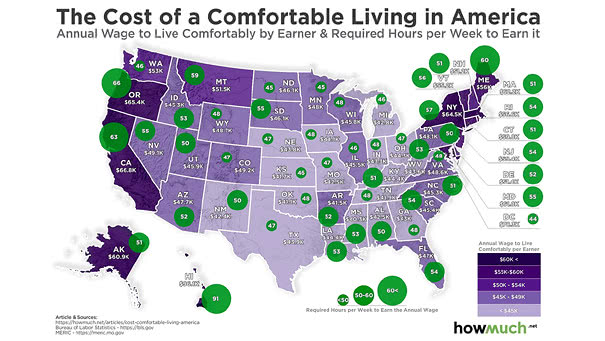
The Cost of a Comfortable Living in the United States This map shows how long Americans need to work to enjoy a comfortable life. Image: howmuch.net Click the Image to Enlarge
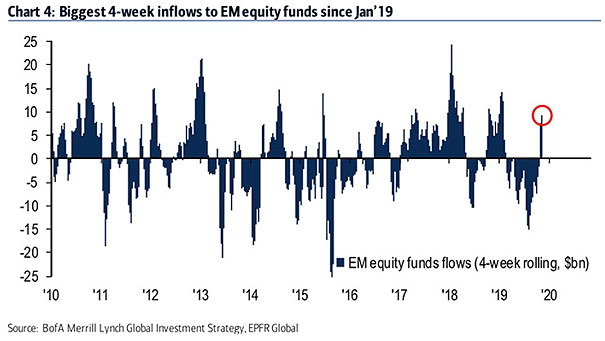
Inflows to Emerging Market Equity Funds Investors are back into emerging markets equities. This is the biggest 4-week inflows to emerging market equity funds since January 2019. Image: BofA Merrill Lynch Global Research