U.S. Share Buybacks and VIX
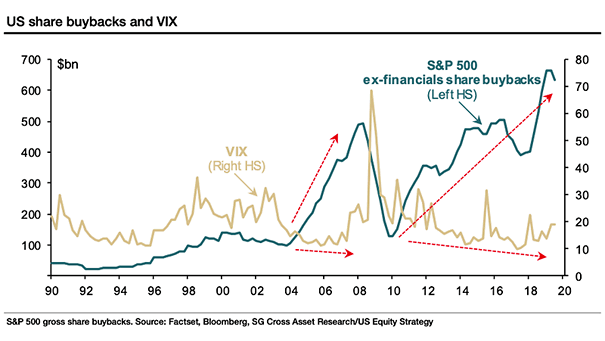
U.S. Share Buybacks and VIX Interesting chart suggesting the relationship between U.S. share buybacks and VIX. Image: Societe Generale Cross Asset Research
U.S. Share Buybacks and VIX Interesting chart suggesting the relationship between U.S. share buybacks and VIX. Image: Societe Generale Cross Asset Research
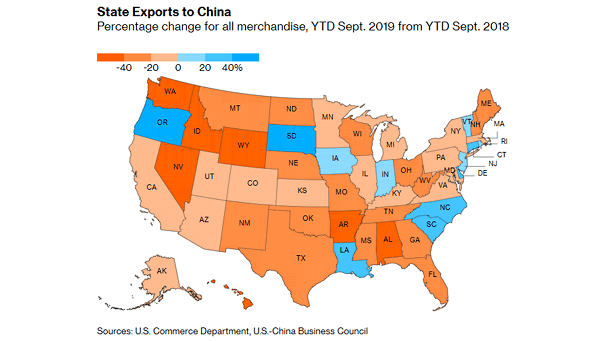
Trade War: U.S. State Exports to China The trade war is hurting exports to China across the U.S.. Image: Bloomberg
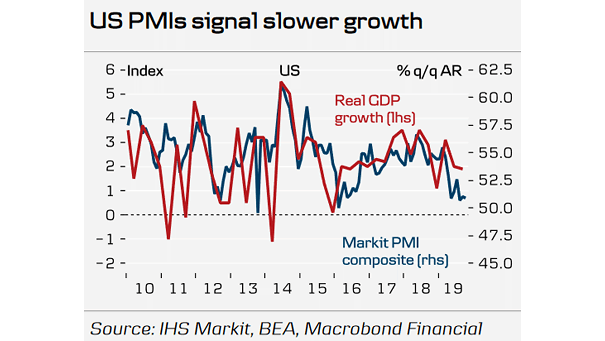
Markit PMIs Composite and U.S. Real GDP Growth October PMIs suggest a modest U.S. real GDP growth. Image: Danske Bank
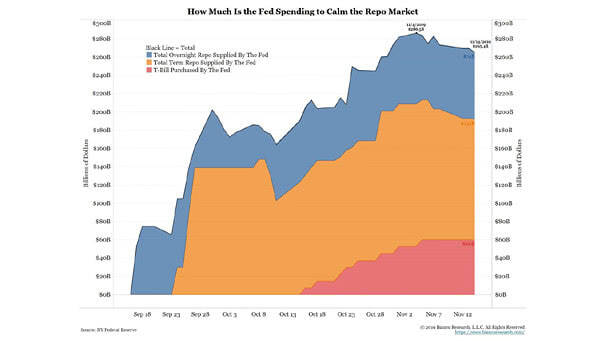
U.S. Repo Market and the Fed Interesting chart showing that the Fed is pumping hundreds of billions into the repo market. Image: Bianco Research
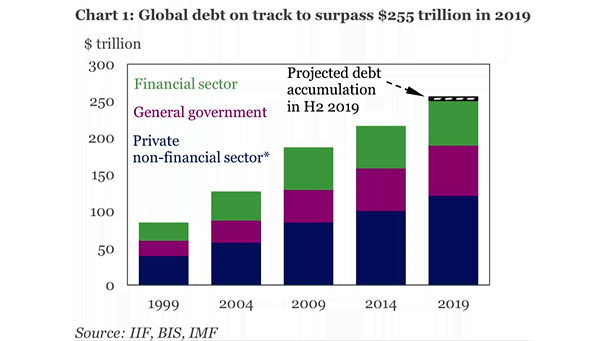
Global Debt IIF expects the global debt load to exceed $255 trillion in 2019, largely driven by the United States and China. Image: Institute of International Finance
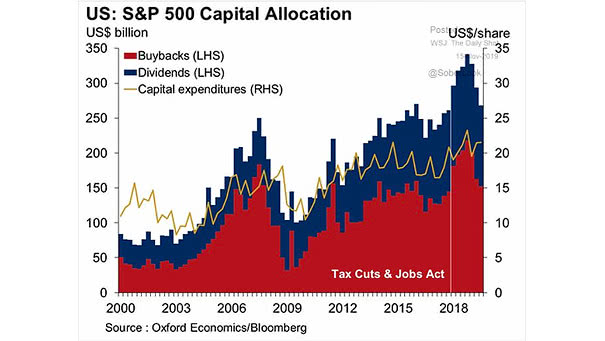
S&P 500 Capital Allocation – Dividends, Buybacks and Capital Expenditures 2018 corporate tax cut boosted dividends and buybacks, but not capital expenditures. Image: Oxford Economics
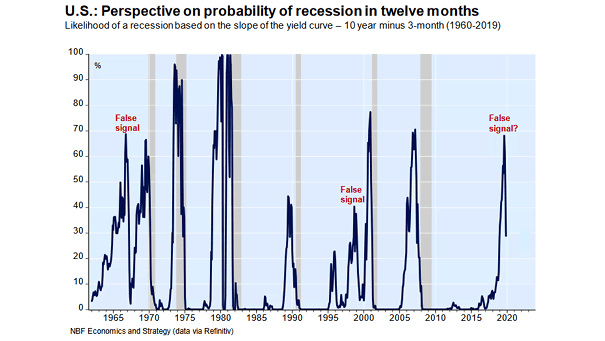
Probability of U.S. Recession in 12 Months Based on the Slope of the Yield Curve The yield curve slope suggests odds of a recession in the next 12 months at less than 30% in the…
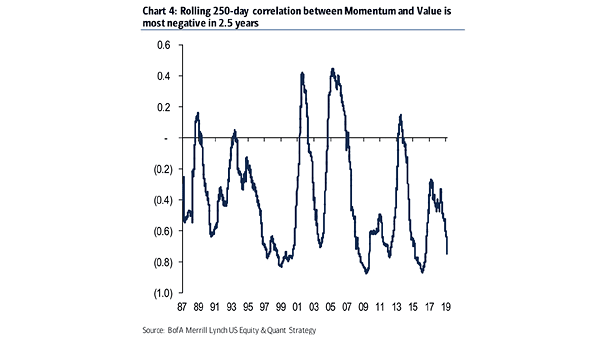
Correlation Between Value and Momentum The correlation between value and momentum is near record lows. Below this level, value outperformed momentum over the next 250 days (77% of the time) since 1986. Image: BofA Merrill…
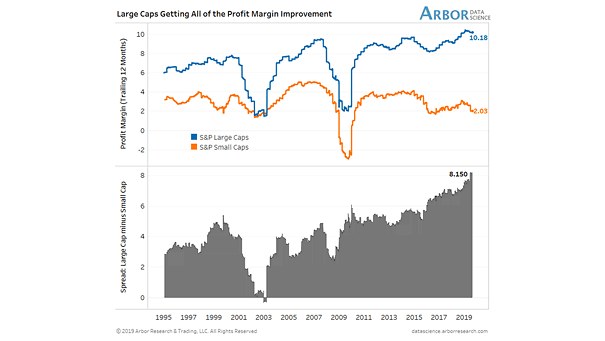
Profit Margins of S&P Large Caps and Small Caps Profit margins between small and large caps are widening. Industries with highest concentrations are getting all of the profit margin improvement. Image: Arbor Research & Trading…
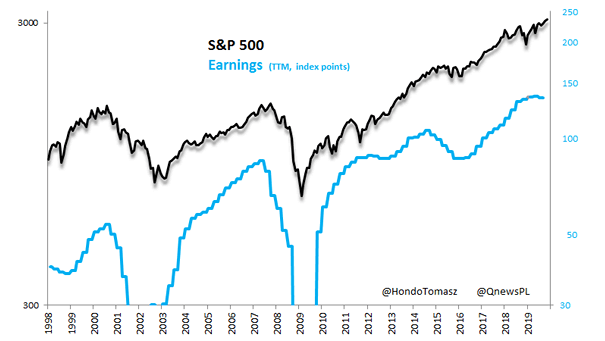
S&P 500 Earnings So far, S&P500 earnings are not down dramaticaly as in previous bear markets. Image: Quercus TFI S.A.
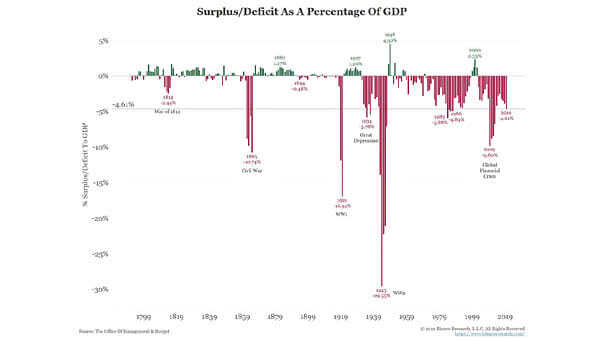
U.S. Surplus/Deficit As A Percentage of GDP The US federal government’s budget deficit jumps above $1 trillion for the first time over the past 12 months. Image: Bianco Research