S&P 500 and U.S. Initial Jobless Claims
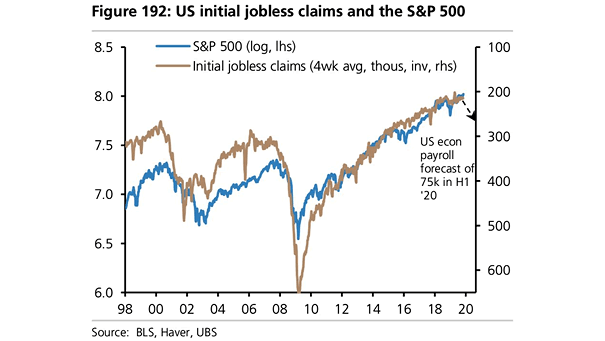
S&P 500 and U.S. Initial Jobless Claims So far, the correlation between the S&P 500 and initial jobless claims has worked well for years. Image: UBS
S&P 500 and U.S. Initial Jobless Claims So far, the correlation between the S&P 500 and initial jobless claims has worked well for years. Image: UBS
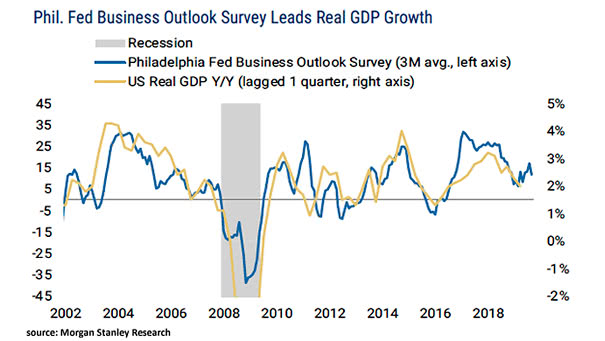
Philadelphia Fed Business Outlook Survey Leads U.S. Real GDP Growth Chart suggesting that the Philadelphia Fed business outlook survey leads U.S. real GDP by 3 months. Image: Morgan Stanley Research

Baseline Equity Returns (5 Years) Chart suggesting that high market valuations will affect equity returns in the coming years. Image: Oxford Economics
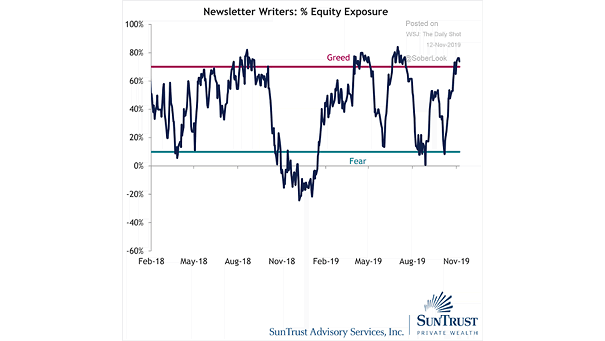
Investment Newsletters: Percentage of Equity Exposure Are investment newsletters too optimistic? Image: Truist
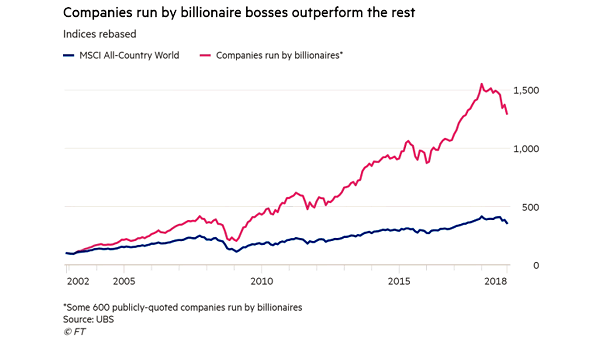
MSCI ACWI Index and Companies Run by Billionaires Are billionaires the best corporate leaders and victims of bias in the media? Image: Financial Times
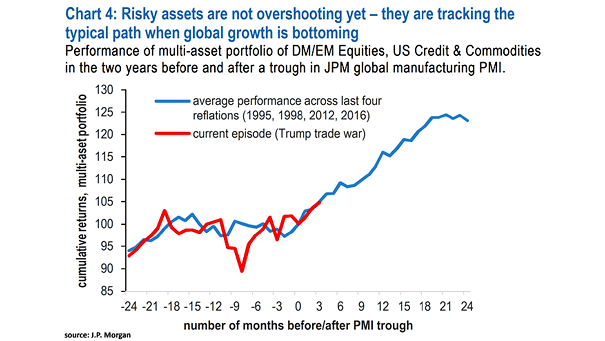
Risky Assets Performance and Global Manufacturing PMI Interesting chart suggesting that risky assets are currently following the typical path when global growth is bottoming. Image: J.P. Morgan Asset Management
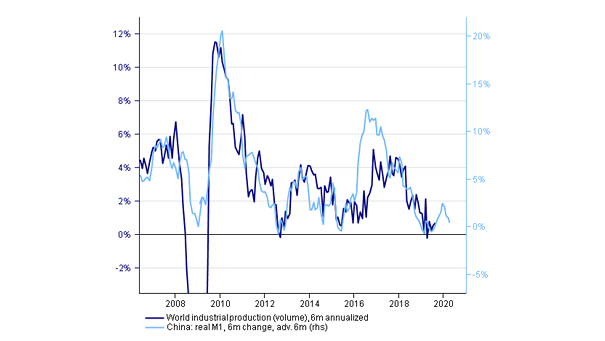
China Real M1 Leads World Industrial Production Chart suggesting that China’s real M1 leads world industrial production by 6 months. Image: Nordea, Sebastian Dypbukt Källman
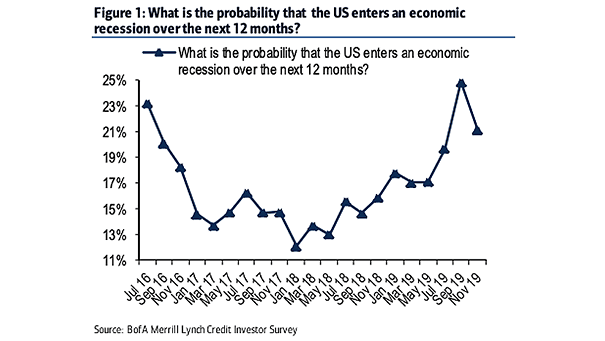
Survey – U.S. Recession Probability U.S. recession fears are fading and U.S. credit investors now see a 21% chance of recession over the next 12 months. It was 25% in September. Image: BofA Credit Investor…
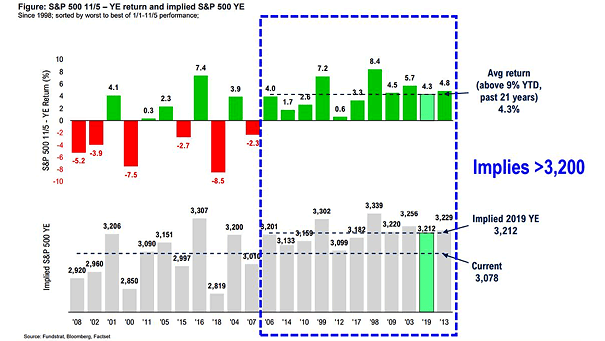
S&P 500 First Week of November to Year-End Return Interesting chart suggesting that the return from 11/5 to the end of this year could be around 4%, and the S&P 500 Index above 3,200. Image:…
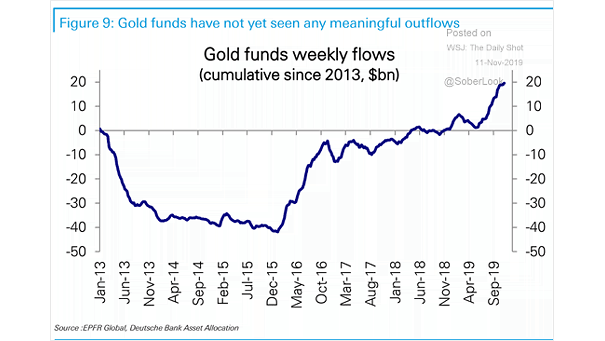
Gold Funds Weekly Flows Chart showing that gold funds have not yet seen any meaningful outflows. Image: Deutsche Bank Global Research
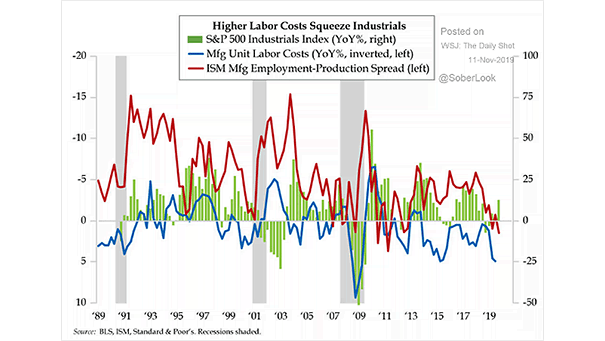
S&P 500 Industrials Index and U.S. Manufacturing Unit Labor Costs When U.S. labor costs rise, industrial profit margins are under pressure. Image: Quill Intelligence, LLC