Number of Listed Companies in the U.S.
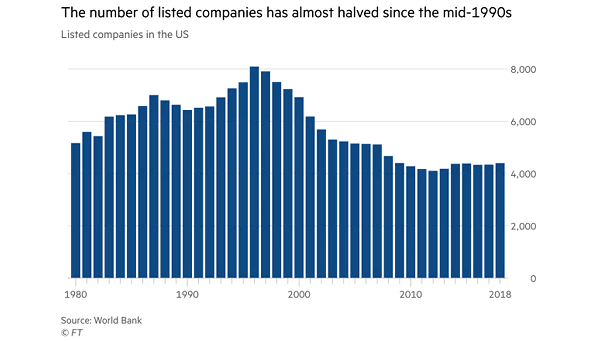
Number of Listed Companies in the U.S. The U.S. stock market is shrinking. There are fewer firms listed on U.S. stock exchanges than 20 years ago. Image: Financial Times
Number of Listed Companies in the U.S. The U.S. stock market is shrinking. There are fewer firms listed on U.S. stock exchanges than 20 years ago. Image: Financial Times
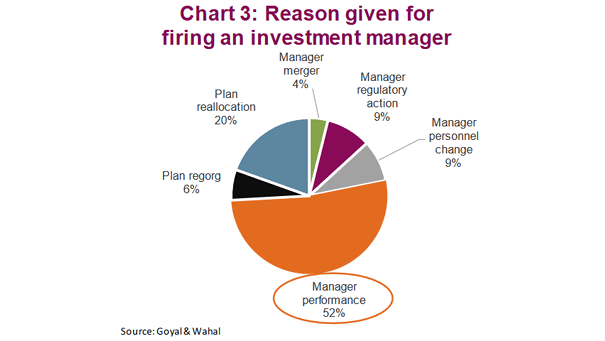
Reason Given For Firing an Investment Manager The manager’s performance is always what matters in the end. Image: Richardson Wealth
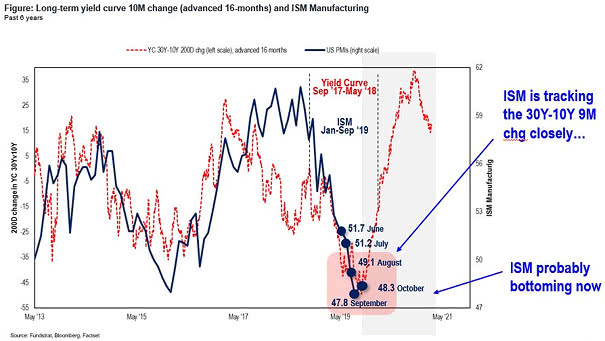
200D Change in Yield Curve 30Y-10Y Leads U.S. ISM Manufacturing Index This great chart suggests that 200-Day Change in Yield Curve 30-Year minus 10-Year spread leads U.S. ISM Manufacturing Index by 16 months. It also suggests…
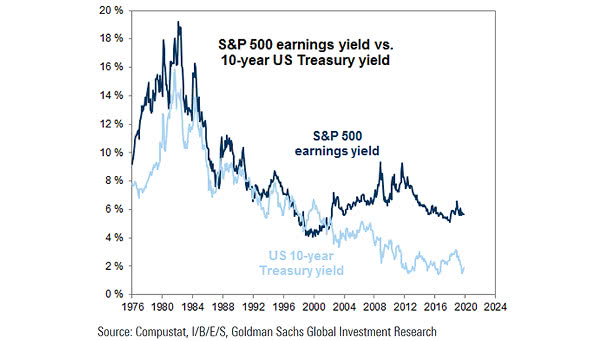
S&P 500 Earnings Yield vs. 10-Year U.S. Treasury Yield The gap between the S&P 500 earnings yield and the 10-year U.S. Treasury yield is currently relatively high. Image: Goldman Sachs Global Investment Research
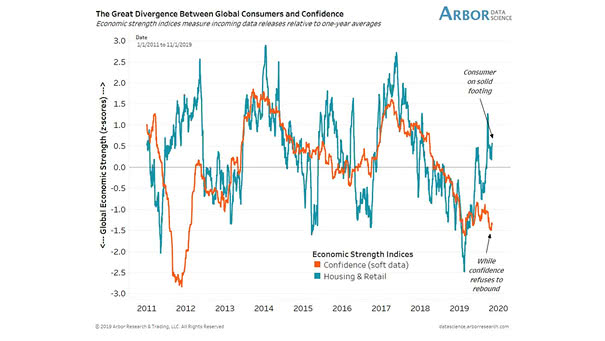
Global Consumers (Housing and Retail) vs. Confidence (Soft Data) Chart showing the large divergence between global hard data and confidence (soft data). Confidence still refuses to rebound. Image: Arbor Research & Trading LLC
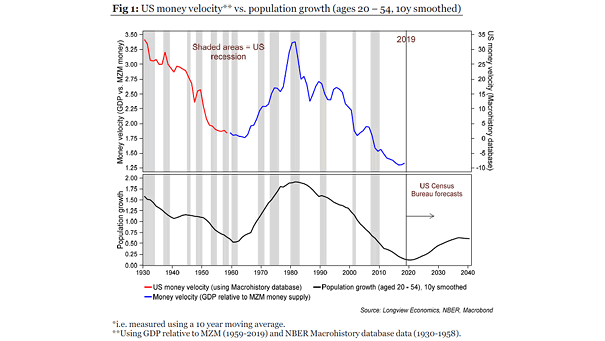
Demographics – U.S. Money Velocity and Population Growth The population of 20-54s will start to increase and could therefore lead to higher money velocity. Image: Longview Economics
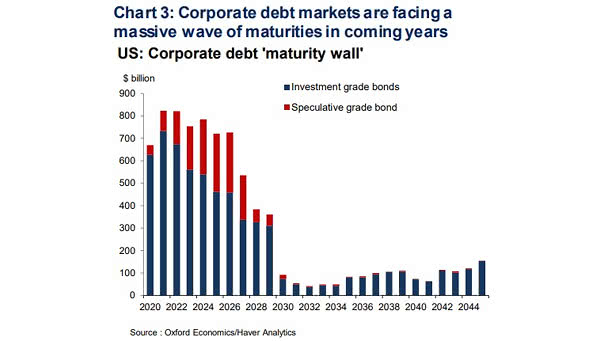
U.S. Corporate Debt Maturity Wall This chart shows the massive wave of maturities faced by investment-grade and speculative-grade U.S. companies in coming years. Image: Oxford Economics
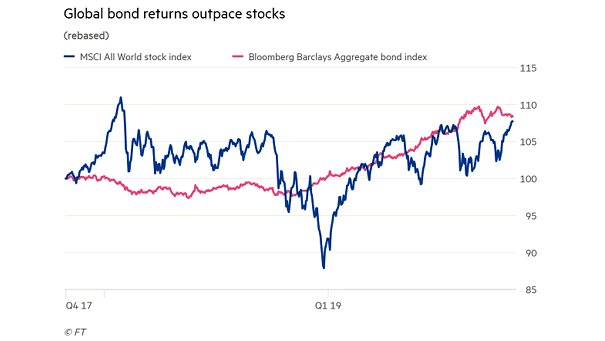
MSCI ACWI Returns vs. Global Bond Returns This chart shows that global bond returns are outpacing stocks. Image: Financial Times
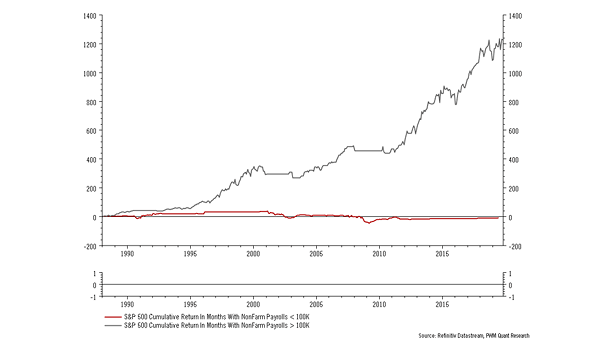
S&P 500 Return vs. NonFarm Payrolls Since 1988, the cumulative return of the S&P 500 has been much better when nonfarm payrolls have exceeded 100,000. Image: Pictet Wealth Management
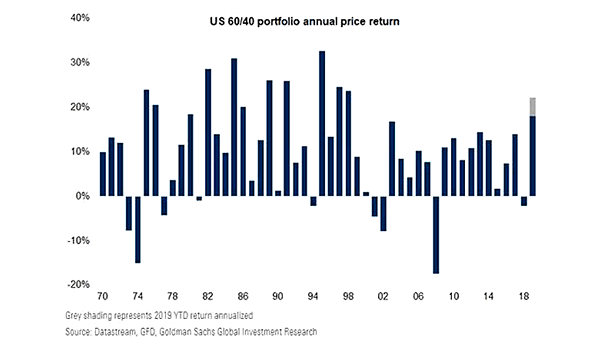
U.S. 60/40 Portfolio Annual Price Return So far this year, the standard U.S. 60/40 portfolio has had its best year in two decades. Image: Goldman Sachs Global Investment Research
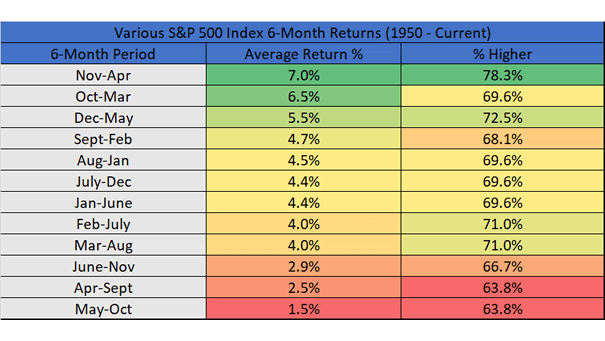
Various S&P 500 Index 6-Month Returns Since 1950 Historically, the Nov-Apr period is the best 6 months of the year for stocks. Image: Ryan Detrick, LPL Financial LLC