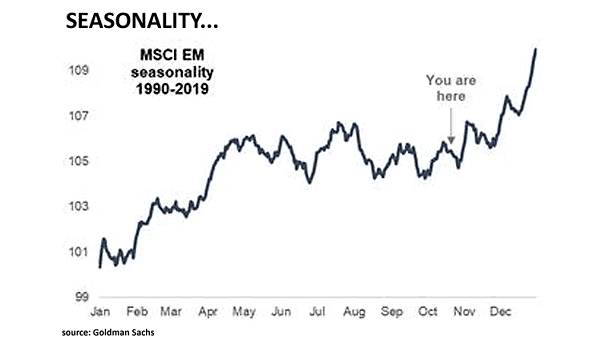
MSCI Emerging Markets Seasonality
MSCI Emerging Markets Seasonality Chart showing the MSCI EM seasonality chart since 1990. This is not a forecast. Image: Goldman Sachs Global Investment Research
MSCI Emerging Markets Seasonality Chart showing the MSCI EM seasonality chart since 1990. This is not a forecast. Image: Goldman Sachs Global Investment Research
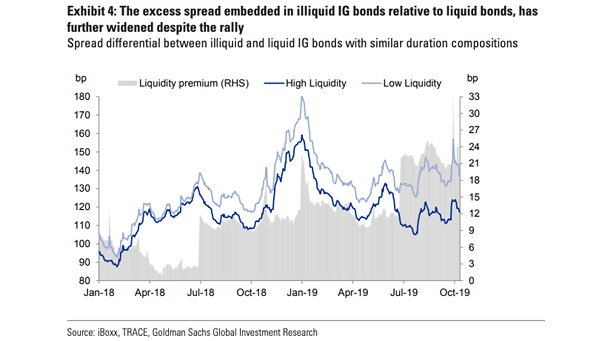
Liquidity Premium and IG Bonds The spread between low liquid and high liquid IG bonds is widening, despite the rally and the belief of an improvement in US-China trade tensions. Image: Goldman Sachs Global Investment…
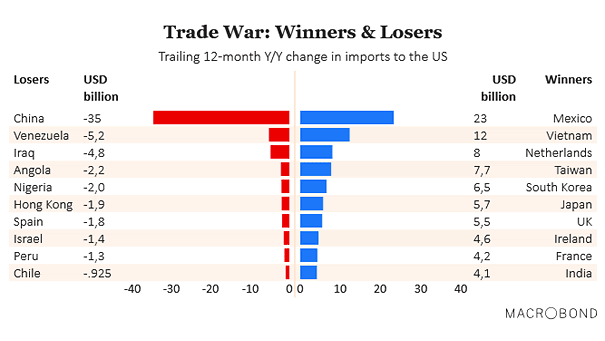
Trade War: Winners and Losers Chart showing the biggest winners and losers of imports to the U.S. in the past year. Image: Macrobond
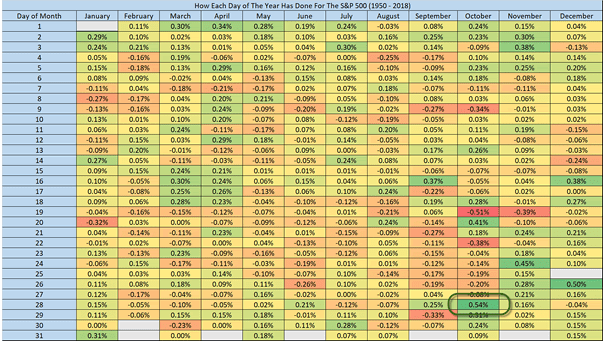
S&P 500 Average Return for Each Day This spreadsheet shows the S&P 500 average return for each day from 1950 to 2018. “History never repeats itself but it rhymes” –Mark Twain. October 28 has been historically the…
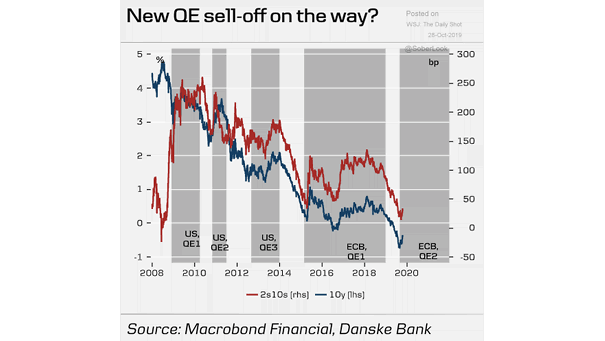
QE and Bond Yields Chart suggesting that bond yields tend to move higher after quantitative easing starts. Image: Danske Bank
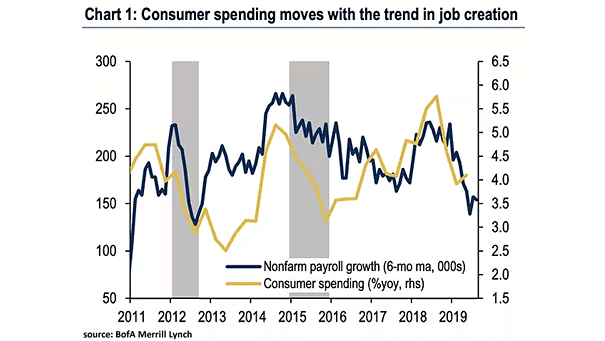
U.S. Consumer Spending and Nonfarm Payroll Growth U.S. consumers may spend less going forward. Slower job growth usually leads to a slowdown in consumer spending. Image: BofA Merrill Lynch Global Research
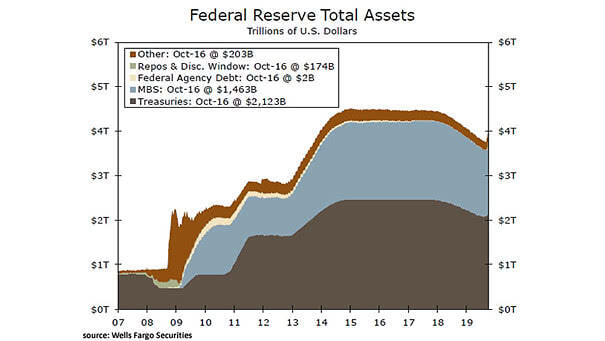
Federal Reserve’s Balance Sheet This chart shows the Federal Reserve total assets. According to the NY Fed, the Fed’s balance sheet could be between $3.8 trillion and $4.7 trillion by 2025. Image: Wells Fargo Securities,…
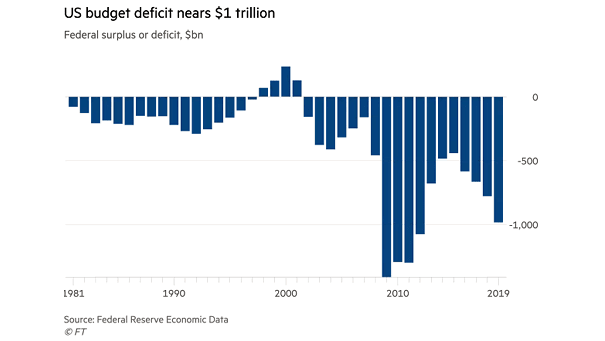
U.S. Budget Deficit Government spending increases despite President Trump’s promise to eliminate debt. Image: Financial Times
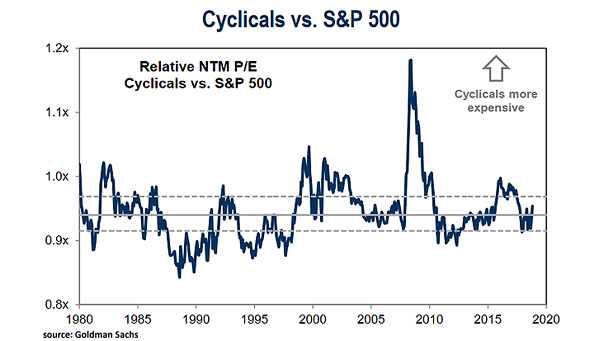
Cyclicals vs. S&P 500 Chart suggesting that cyclicals are not overvalued vs. S&P 500. Image: Goldman Sachs Global Investment Research
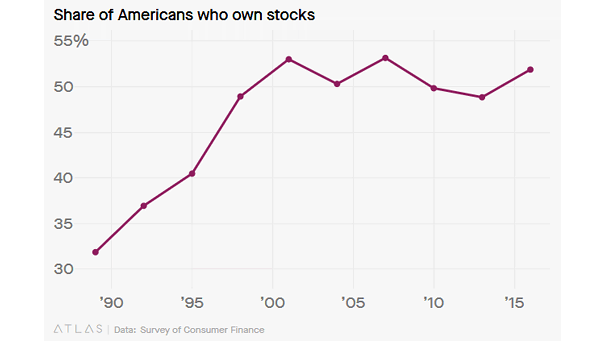
Share of Americans Who Own Stocks More and more Americans are invested in the stock market. 30 years ago, only about 30%. More than 50%, today. Image: Atlas, Survey of Consumer Finances
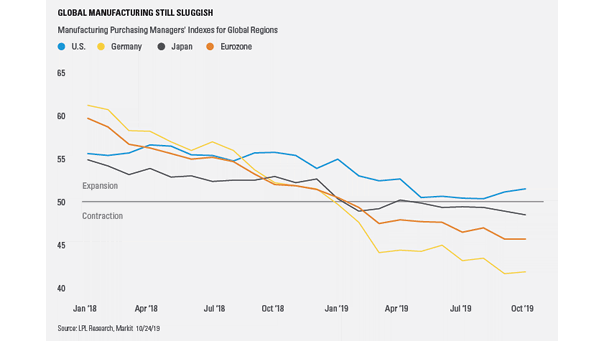
Global Manufacturing PMI Manufacturing PMI is still sluggish in the world, but it is trying to stop going down in the United States. Image: LPL Research