Length of U.S. Recessions
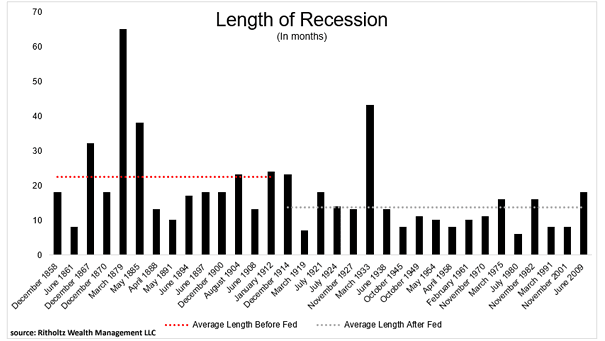
Length of U.S. Recessions This chart puts into perspective the length of U.S. recessions, before and after the Fed. Image: Ritholtz Wealth Management LLC
Length of U.S. Recessions This chart puts into perspective the length of U.S. recessions, before and after the Fed. Image: Ritholtz Wealth Management LLC
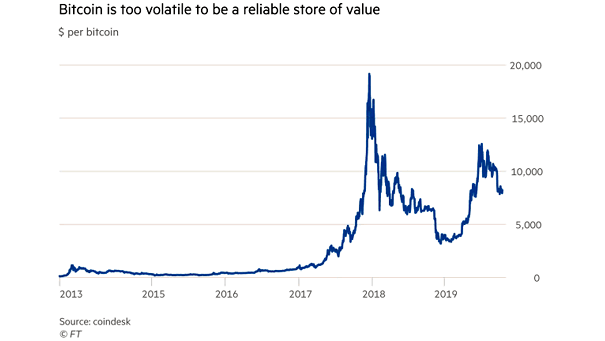
Bitcoin Volatility The price of Bitcoin exhibits high volatility persistence. Has Bitcoin failed as a means of payment and store of value? Image: Financial Times
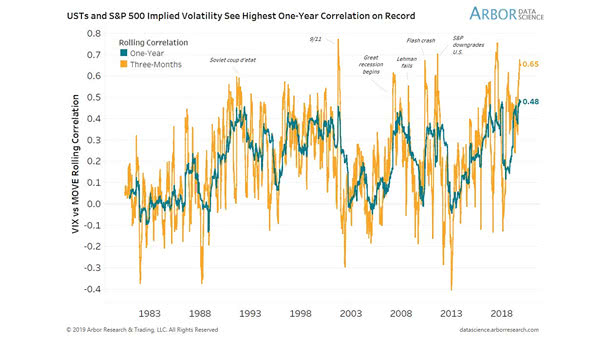
VIX and MOVE Rolling Correlation Periods of high correlation between safe and risk assets are generally not good for balanced portfolios, because diversification is hard to find. Image: Arbor Research & Trading LLC

Yield Curve and Banks A steeper yield curve helps banks to borrow more cheaply and lend at higher rates of interest. Image: Morgan Stanley
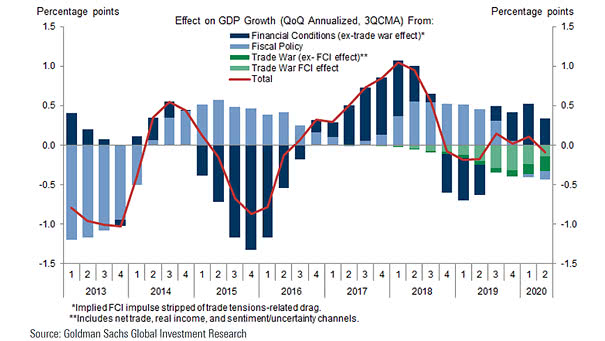
Effect on U.S. GDP Growth from Financial Conditions, Fiscal Policy and Trade War Financial Conditions should offset the effect of the trade war in 2020. Image: Goldman Sachs Global Investment Research
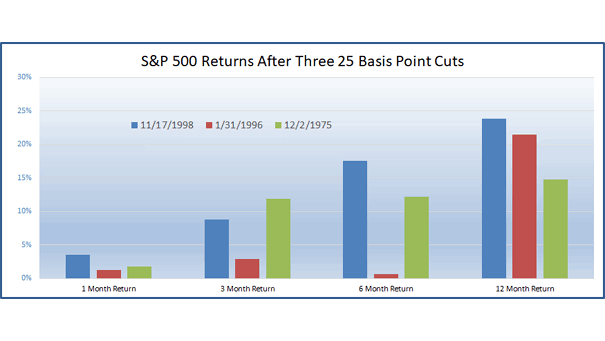
S&P 500 Returns After Three 25 Basis Point Rate Cuts Chart showing what the S&P 500 did after three rate cuts of 25 basis points in 1975, 1996 & 1998. Image: Ryan Detrick, LPL Financial…
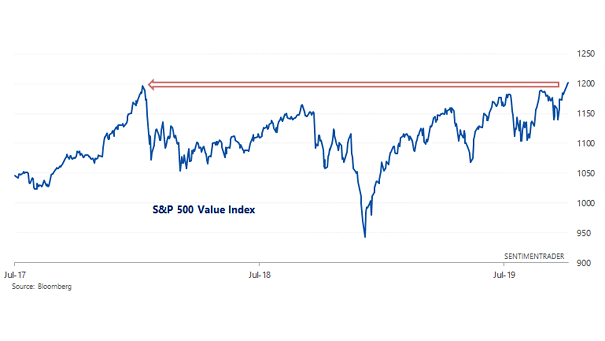
S&P 500 Value Index at All-Time High Historically, when the S&P 500 Value Index made a new all-time high for the first time in 200+ days, it went higher 6 months later. Image: Sentimentrader
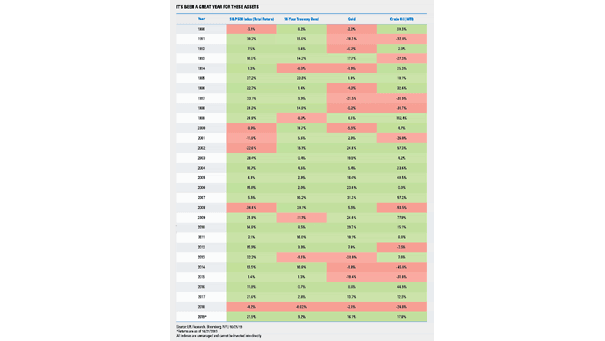
Asset Class Returns in YTD 2019 The S&P 500 Index, US Treasury bonds, gold and crude oil are all positive this year. This situation is quite rare. It never happened before, to have them all…
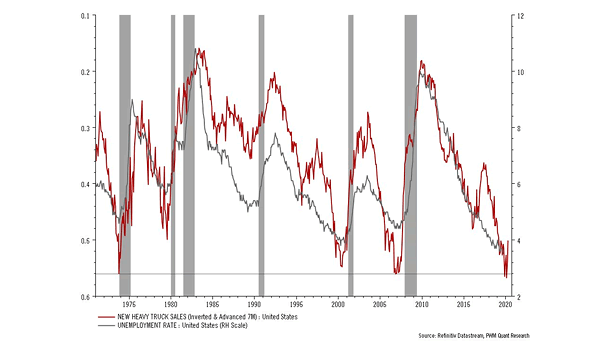
U.S. New Heavy Truck Sales Lead U.S. Unemployment Rate Chart suggesting that U.S. new heavy truck sales lead the U.S. unemployment rate by 7 months. Image: Pictet Wealth Management
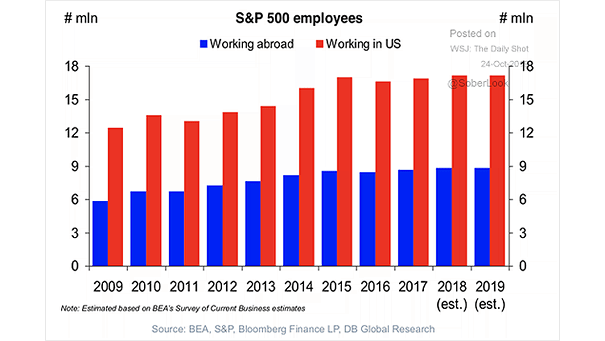
S&P 500 Employees Why S&P 500 companies aren’t so American? A large portion of S&P 500 employees works abroad. Image: Deutsche Bank Global Research
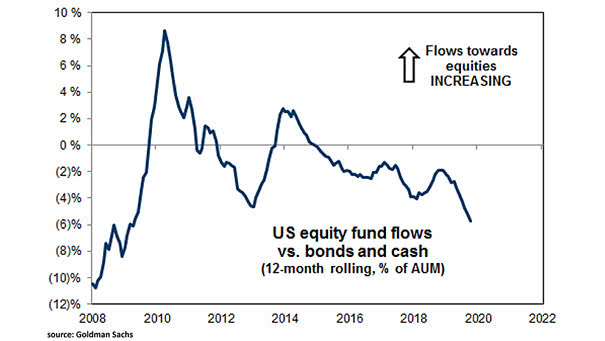
U.S. Equity Fund Flows vs. Bonds and Cash This chart puts into perspective the rotation from equities to bonds and cash, as investors become cautious about further growth. Image: Goldman Sachs Global Investment Research