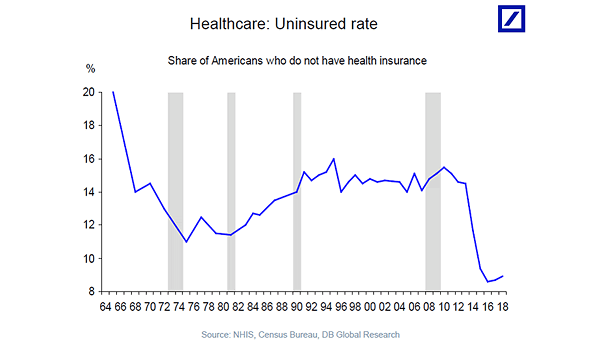
Health Care: Uninsured Rate
Health Care: Uninsured Rate Chart showing that the uninsured rate was down until the last year. Image: Deutsche Bank Global Research
Health Care: Uninsured Rate Chart showing that the uninsured rate was down until the last year. Image: Deutsche Bank Global Research
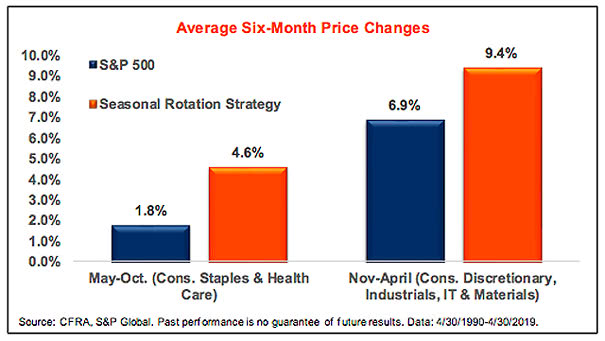
S&P 500 and Seasonal Rotation Strategy Sell in May and go away? This chart suggests that a rotation between defensive and cyclical sectors was a much better strategy Image: CFRA, S&P Global
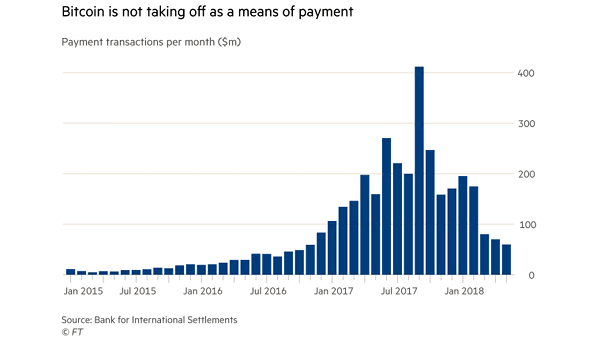
Bitcoin and Payment Transactions Per Month Is cryptocurrency overhyped? Today, Bitcoin is processing fewer payment transactions per month than in 2016. Image: Financial Times
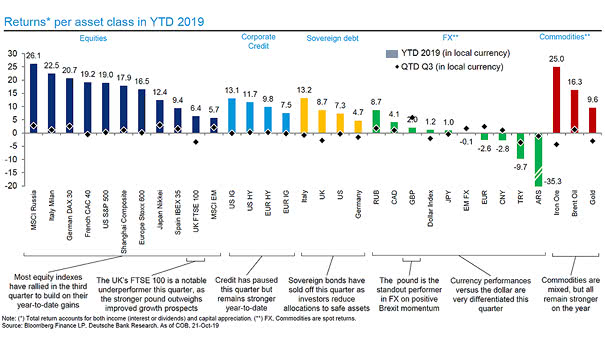
Returns Per Asset Class in YTD 2019 This chart shows what investors should have bought in 2019. Image: Deutsche Bank Global Research
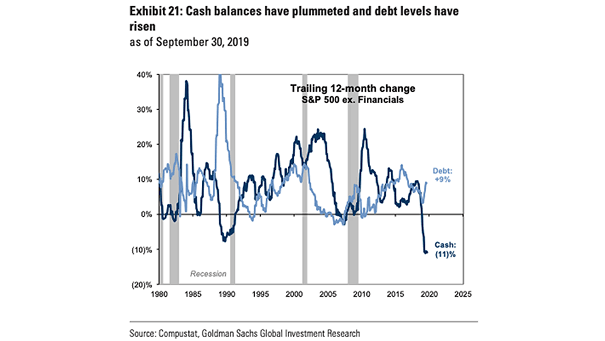
S&P 500 Cash Balances and Debt Levels During the past 12 months, non-financial S&P 500 cash balances have declined by -11% and debt levels have inflected higher by +9%. Image: Goldman Sachs Global Investment Research
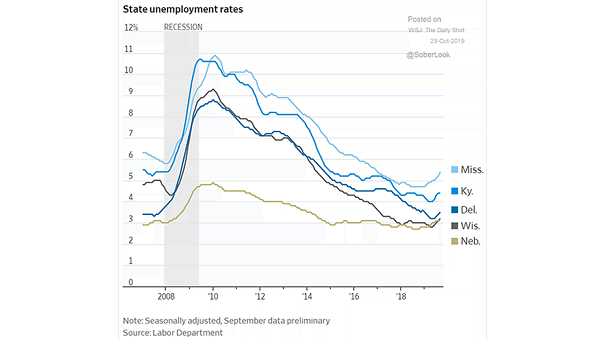
U.S. State Unemployment Rates The unemployment rate is increasing in some states. Image: The Wall Street Journal
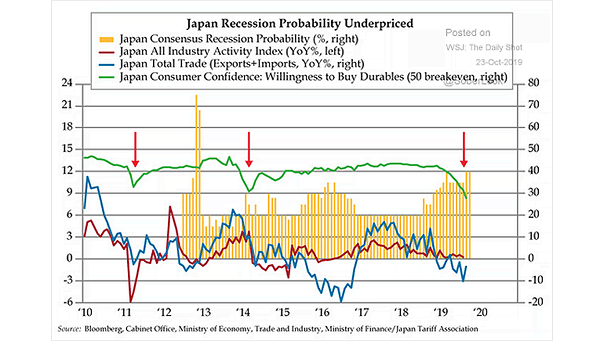
Japan Recession Probability Chances of a recession in Japan are pretty high. Image: Quill Intelligence, LLC
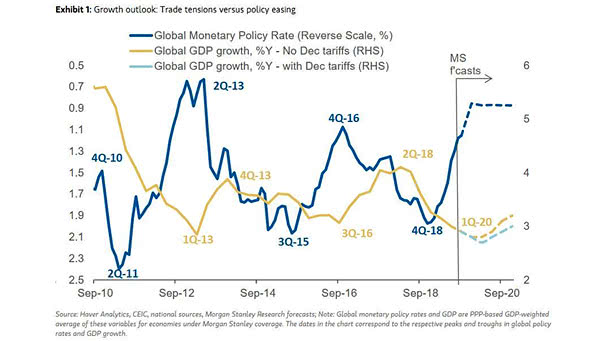
Global GDP Growth Outlook – Trade Tensions vs. Policy Easing The escalation of trade tensions is a risk to the global economy outlook. Image: Morgan Stanley Research
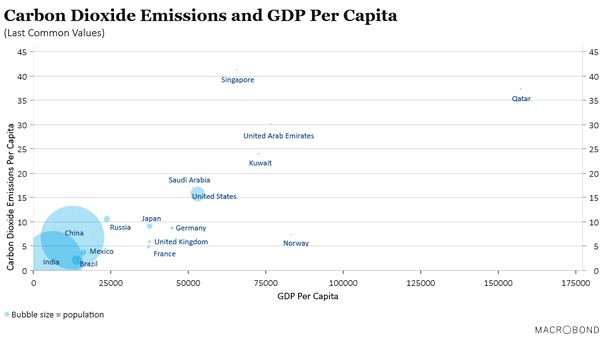
Carbon Dioxide Emissions (CO2) and GDP Per Capita Interesting chart showing carbon dioxide emissions and GDP per capita for some countries. Did you expect that? Image: Macrobond
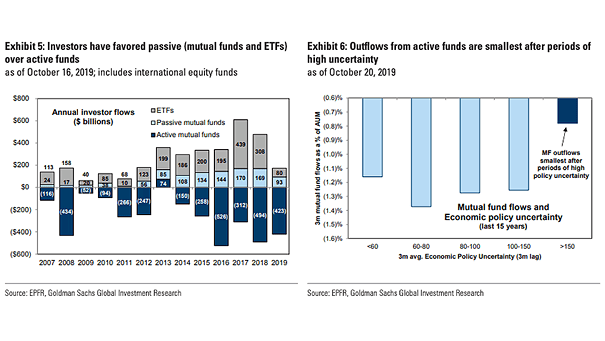
Passive Over Active Funds History suggests that investor outflows from active funds are smallest after periods of high policy uncertainty. Image: Goldman Sachs Global Investment Research
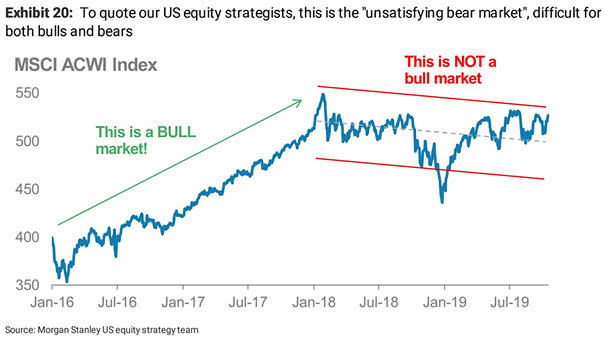
MSCI ACWI Index – Bull and Bear Market As Morgan Stanley points out, this is the “unsatisfying bear market”, difficult for both bulls and bears. Image: Morgan Stanley Research