Global Risk Sentiment Indicators
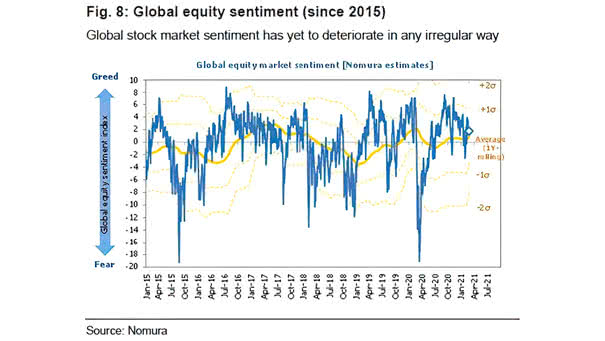
Global Risk Sentiment Indicators Sentiment indicators suggest a “Goldilocks” scenario for risk appetite—investors are moderately optimistic, cautiously taking on risk without exuberance. Image: TS Lombard
Global Risk Sentiment Indicators Sentiment indicators suggest a “Goldilocks” scenario for risk appetite—investors are moderately optimistic, cautiously taking on risk without exuberance. Image: TS Lombard
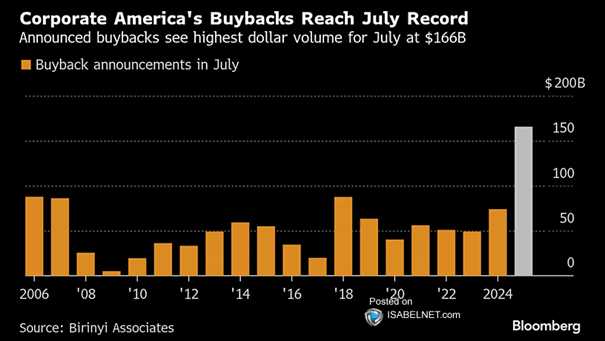
Corporate America’s Announced Buybacks July’s record $166 billion in share repurchases played a key role in driving an annual buyback pace that may exceed $1 trillion in 2025, reflecting solid corporate confidence and return-of-capital strategies.…
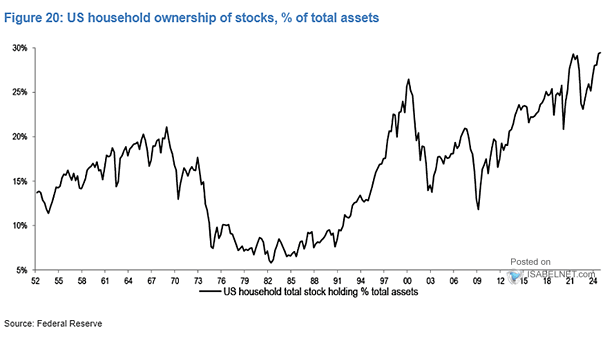
U.S. Household Ownership of Stocks, % of Total Assets An elevated equity exposure among U.S. households does not necessarily signal an imminent market downturn, but it underscores the importance of cautious investment strategies and prudent…
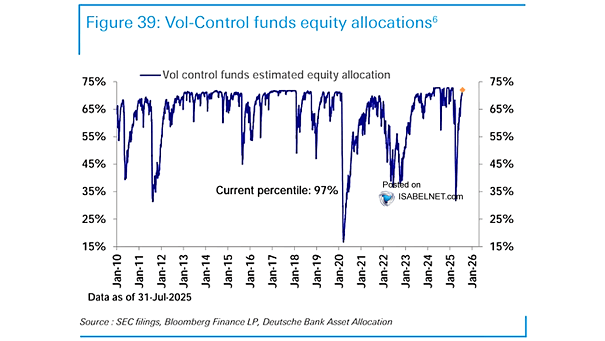
Volatility Control Funds Estimated Equity Allocation Vol-control funds have near-record equity exposure by historical standards, sitting at the 97th percentile, which reflects strong confidence in the equity market risk environment. Image: Deutsche Bank Asset Allocation
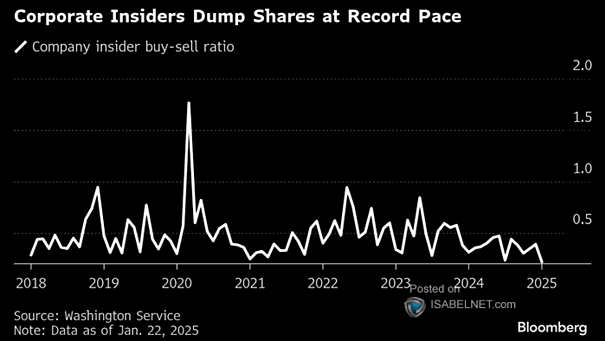
Company Insider Buy-Sell Ratio Insider buying has recently dried up, with insider purchases falling behind insider sales by the most since July 2024—this may reflect either executive caution or opportunistic profit-taking. Image: Bloomberg
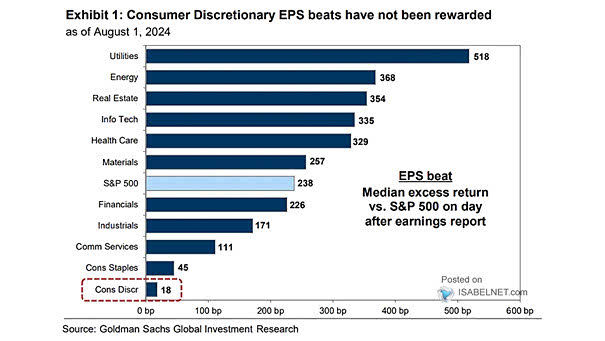
Median Excess Return vs. S&P 500 on Day After Earnings Report Strong earnings surprises boosted U.S. stocks in 2Q, but with already high expectations entering the quarter, the price reaction was somewhat limited compared to…
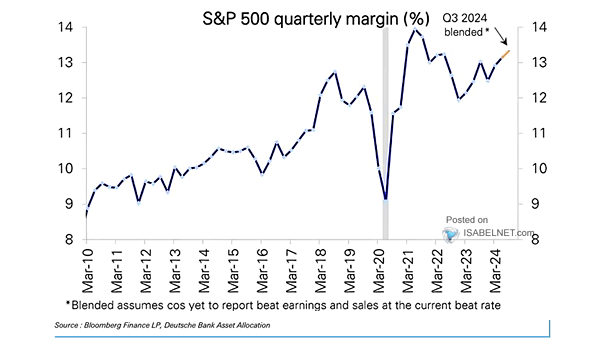
S&P 500 Quarterly Margin Growth in the high-margin tech sector, economies of scale, network effects, and supportive financial and regulatory environments—key structural shifts—have pushed the S&P 500’s profit margins to nearly a four-year high. Image:…
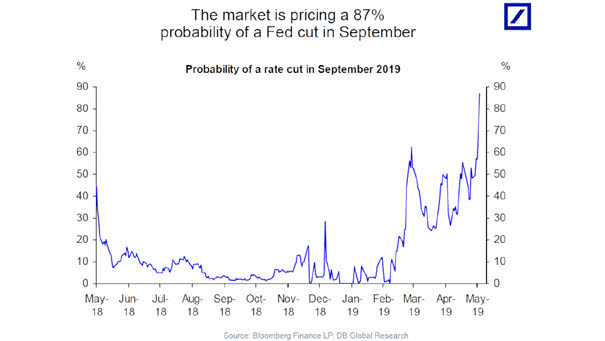
Market Implied Probability of a Fed Cut The odds of a September Fed rate cut have soared—current market pricing now suggests a very high probability after deeply disappointing U.S. labor market data. Image: TS Lombard
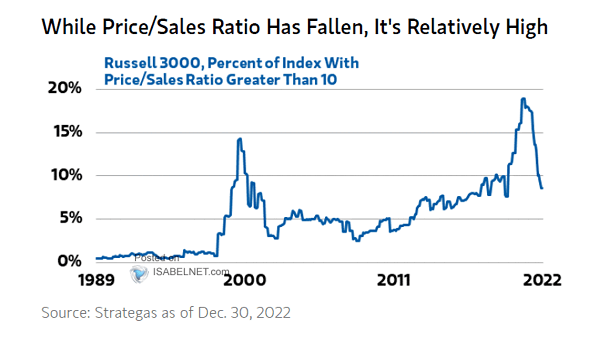
Most Shorted Stocks Relative to Russell 3000 Heavily shorted stocks generally underperform the broader market over the long term, but in 2025, they significantly outperformed, driven primarily by aggressive short covering. Image: Deutsche Bank Asset…
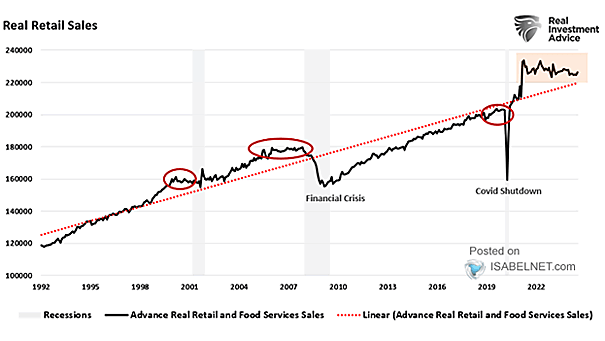
Recession – U.S. Real Retail Sales U.S. real retail sales and consumer confidence trends indicate cautious and subdued consumer spending growth, which has historically been linked to an increased risk of recession. Image: Real Investment…
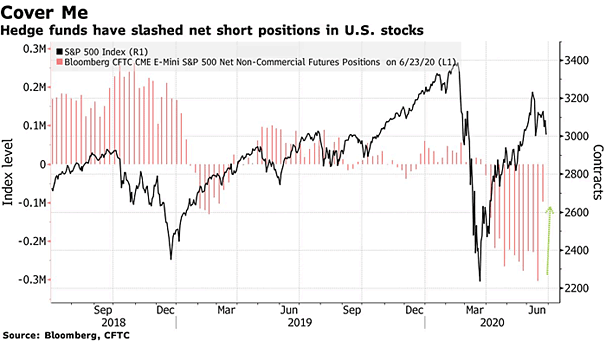
S&P 500 – Hedge Funds vs. Retail Investors The contrast between hedge funds taking short positions and retail investors being long is often seen as a warning of potential equity market weakness over the next…