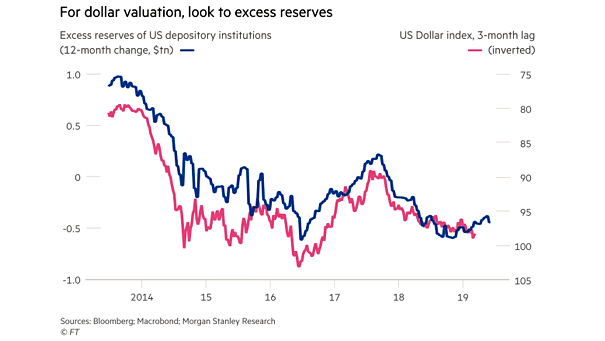
S&P 500 – Fundamental Factors Volatility
S&P 500 – Fundamental Factors Volatility The chart shows factor volatility at its highest level since 2016. Image: Goldman Sachs Global Investment Research
U.S. Nonfarm Employment and NFIB Survey If the trade war continues, it will have serious negative repercussions on the American economy. Image: Deutsche Bank Global Research
U.S. ISM Non-Manufacturing Index vs. U.S. ISM Manufacturing Index and Recessions Interesting chart showing the spread between the U.S. ISM Non-Manufacturing Index and the U.S. ISM Manufacturing Index over time. Image: Pictet Asset Management
S&P 500 Operating EPS vs. USA National Income, Corporate Profits Thanks to buybacks, this chart clearly shows the current divergence. Is a new bubble being formed? Image: Nordea and Macrobond
Holders of Negative Yielding Debt Central banks hold 79% of negative-yielding debt. Image: Deutsche Bank Global Research
U.S. and European Buybacks U.S. and European buybacks as percentage of cash are not at their pre-global financial crisis levels. Image: Goldman Sachs Global Investment Research
China Credit Impulse and Number of Central Banks Easing vs. Tightening Lead Global Manufacturing PMI This chart suggests that China credit impulse and the number of central banks easing vs. tightening lead global manufacturing PMI…
Hedge Fund Equity Exposure Great chart showing that hedge funds’ equity exposure is near their lowest since the global financial crisis. Image: J.P. Morgan
Growth, Momentum, Volatility and Value Factor Performance Chart showing that value stocks make a comeback as momentum and growth stocks get hammered. Image: Goldman Sachs Global Investment Research
Median MSCI World Index vs. Its Seasonal Pattern This chart shows when the median MSCI World Index tends to perform better or worse at certain times of the year. Image: J.P. Morgan
Chinese 5-Year Benchmark Yield Leads Global Manufacturing PMI Great chart suggesting that the Chinese 5-year benchmark yield leads global manufacturing PMI by 18 months. Image: Nordea and Macrobond