S&P 500 Buybacks Index
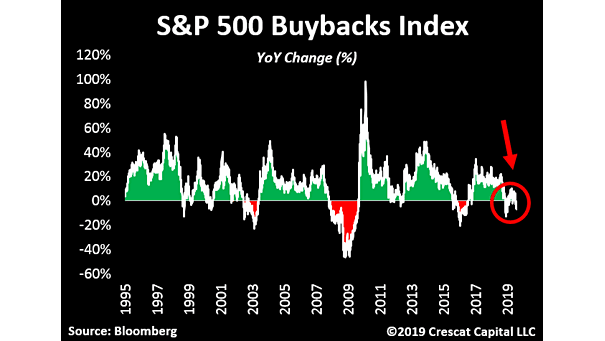
S&P 500 Buybacks Index The S&P 500 Buyback Index is down on a YoY basis. As a reminder, buybacks are the source of the rally in the stock market since 2009. Image: Crescat Capital LLC
S&P 500 Buybacks Index The S&P 500 Buyback Index is down on a YoY basis. As a reminder, buybacks are the source of the rally in the stock market since 2009. Image: Crescat Capital LLC
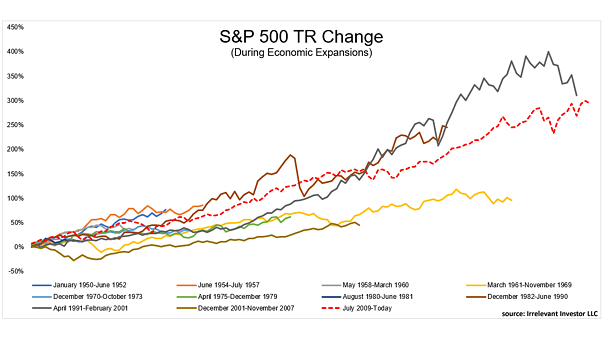
S&P 500 Total Return Change During Economic Expansions The current business cycle is the longest and weakest expansion. The next downturn could hit the U.S. stock market much harder than the economy. Image: Irrelevant Investor…
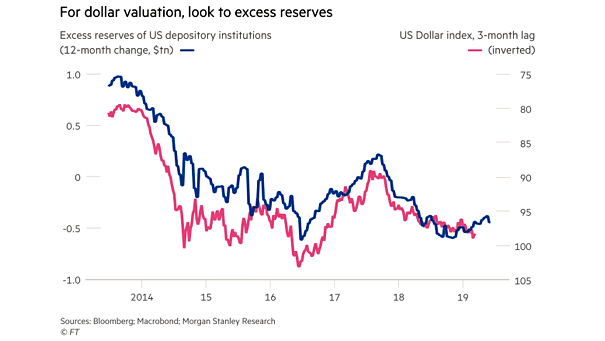
Excess Reserves of U.S. Depository Institutions Lead the U.S. Dollar The chart suggests that excess reserves of U.S. depository institutions lead the U.S. dollar by 3 months. Image: Financial Times
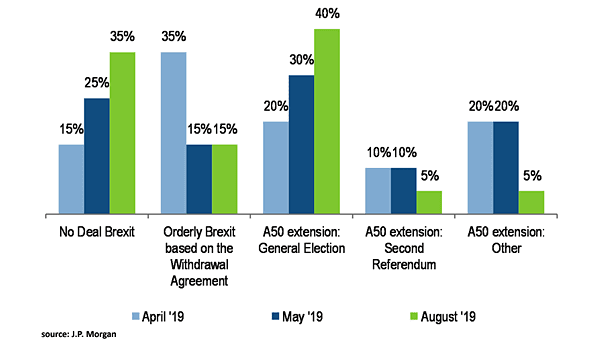
No Deal Brexit According to J.P. Morgan, the risk of a no-deal Brexit remains real and stands at 35%. Image: J.P. Morgan
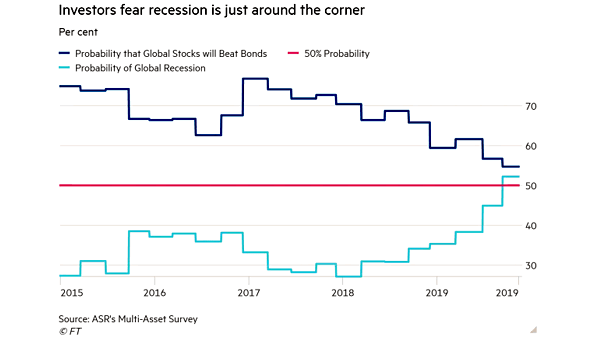
Probability of Global Recession The probability of a global recession among asset managers is greater than 50%. Image: Financial Times
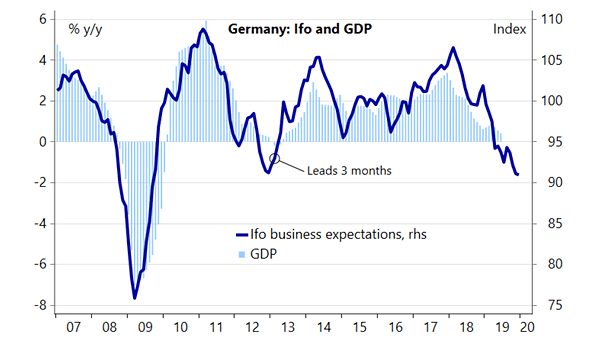
Ifo Business Expectations Index Lead German GDP Chart suggesting that the Ifo Business Expectations Index leads German GDP by 3 months. Image: Nordea and Macrobond
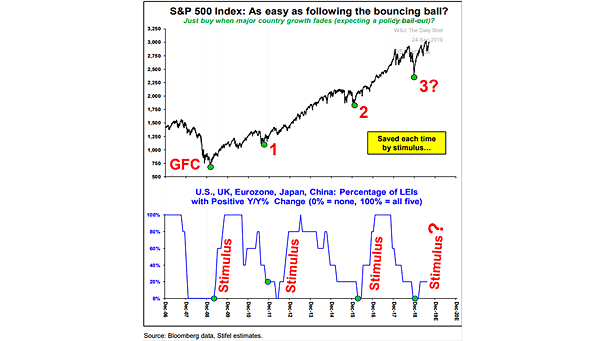
S&P 500 and Leading Economic Index (LEI) This chart shows that stimulus has saved the U.S. stock market each time. Saved once again? Image: Stifel
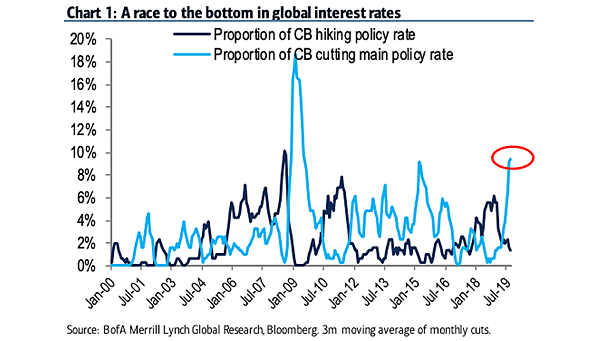
Central Banks Hiking/Cutting Policy Rate A race to the bottom in global interest rates? Central Banks policy rates have started to decline again. Image: BofA Merrill Lynch Global Research
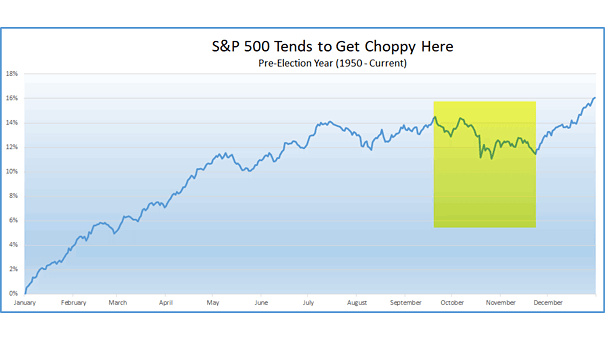
S&P 500 and Pre-Election Year In pre-election years since 1950, the chart suggests that the U.S. stock market doesn’t bottom until Thanksgiving. Image: Ryan Detrick, LPL Financial LLC
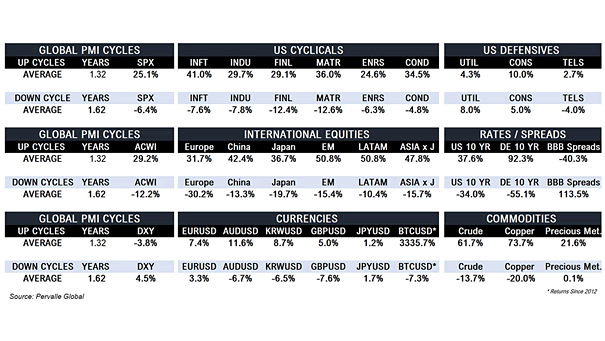
Global PMI Cycles Interesting table showing global PMI cycles: if investors get the global PMI right, they do well. Image: Pervalle Global
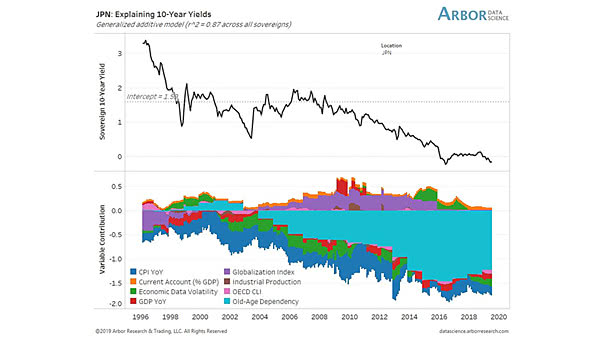
Japan – Explaining 10-Year Yields Great chart suggesting that demographics explain Japan’s 10-year yields. An R² of 0.87 is quite high and significant. Image: Arbor Research & Trading LLC