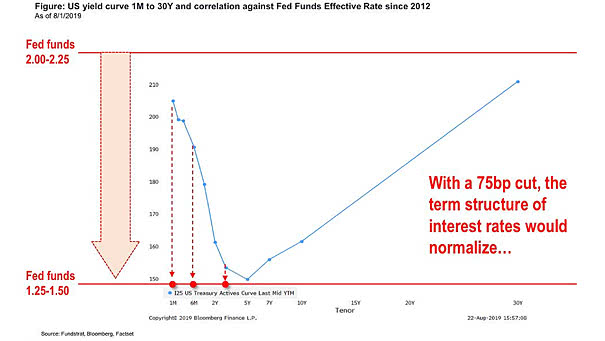
U.S. Government Bond Fund Flows
U.S. Government Bond Fund Flows Over the last six months, U.S. government bond fund flows have been the largest since 1985. Image: Goldman Sachs Global Investment Research
Demographics – Older Societies Have Lower Inflation This interesting chart shows again that an aging population leads to lower inflation (R² = 0.45). Image: Oxford Economics
S&P 500 EPS vs. U.S. Nonfinancial Corporate Profits Creative accounting is imaginative ways to present accounts. The divergences between earnings and U.S. nonfinancial corporate profits occur before recessions. Image: Gavekal, Macrobond
Every Day of the U.S. Stock Market for the Last 10 Years Interesting chart showing that moves over 1% have been quite rare over the last 10 years. Picture souce: Chartr Ltd
U.S. Business Cycle Indicator The Morgan Stanley’s cyclical indicator is still in “downturn.” The entry into the “downturn” phase suggests lower returns for stocks and risky assets. Image: Morgan Stanley Research
ISM Manufacturing Index and U.S. Long-Term Business Cycle The risk of recession increases when the Macro Composite is above 90% and the ISM Manufacturing Index is falling. Image: Pictet Asset Management
S&P 500 Average Stock Price The S&P 500 average stock price reaches a new high, due to the absence of stock splits. Image: Strategas
Fed Funds Rate Leads Money-Market Fund Inflows The chart suggests that Fed funds rate leads money-market fund inflows by two years. Money-market fund inflows stop when risk becomes attractive again. Image: Oxford Economics, Macrobond
S&P 500 Maximum Intra-Year Drawdown Since 1950, the average maximum drawdown for the S&P 500 is -13.5% and the median is -10.6%. You may also like “S&P 500 Index Drawdowns From 2 Year Highs.” Image: LPL…
USA – Explaining 10-Year Yields This great chart suggests that demographics and globalization explain U.S. 10-year yields. Image: Arbor Research & Trading LLC
Zombie Companies on the Rise Investor demand for leveraged loans and artificially low interest rates have created zombie firms. Image: Quick Factset