When Will the Next Global Recession Begin?
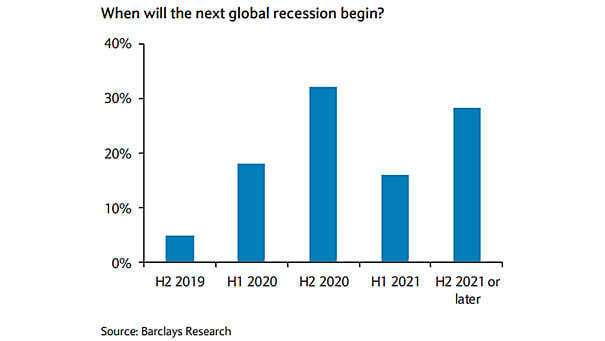
When Will the Next Global Recession Begin? 55% of investors expect a global recession by 2020 and 45% in 2021 or later. Who is right? Image: Barclays Research
When Will the Next Global Recession Begin? 55% of investors expect a global recession by 2020 and 45% in 2021 or later. Who is right? Image: Barclays Research
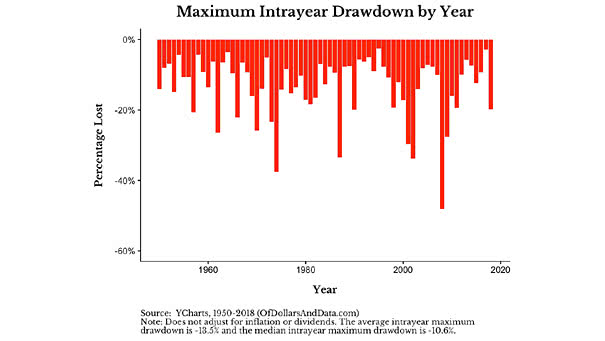
Maximum Intra-Year Drawdown for the S&P 500 Since 1950, the median maximum drawdown for the S&P 500 is -10.6% and the average is -13.5%. You may also like “S&P 500 Index Drawdowns From 2 Year…
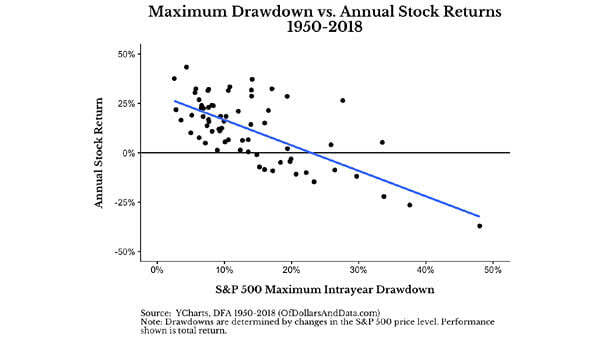
Maximum Drawdown vs. Annual S&P 500 Returns The annual return of the S&P 500 can be positive, even after a large drawdown. Image: Of Dollars And Data
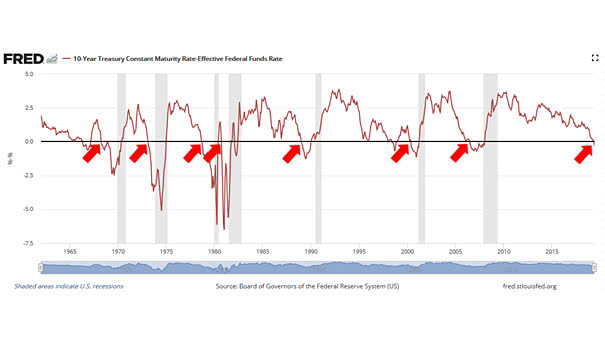
U.S. Yield Curve vs. Recessions The chart shows the 10-year Treasury yield minus Fed funds rate yield curve and recessions. Historically, a flat or inverted yield curve is associated with slow economic growth or recessions.…
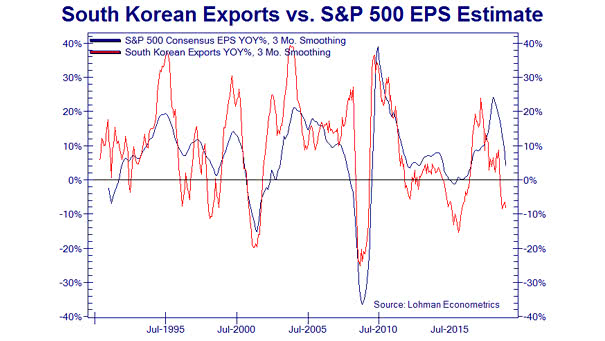
South Korean Exports vs. S&P 500 EPS Estimates The correlation between South Korean exports and S&P 500 EPS estimates suggests a weakness in S&P 500 earnings estimates. Image: Lohman Econometrics
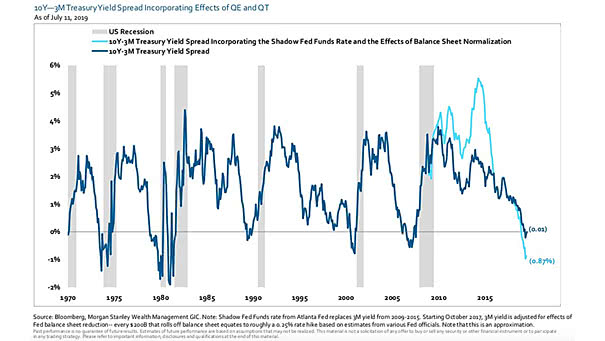
10Y-3M Treasury Yield Spread Adjusted for QE and QT Adjusted for quantitative easing (QE) and quantitative tightening (QT), the 10-year minus 3-month yield curve may have inverted in December 2018. Image: Morgan Stanley Wealth Management
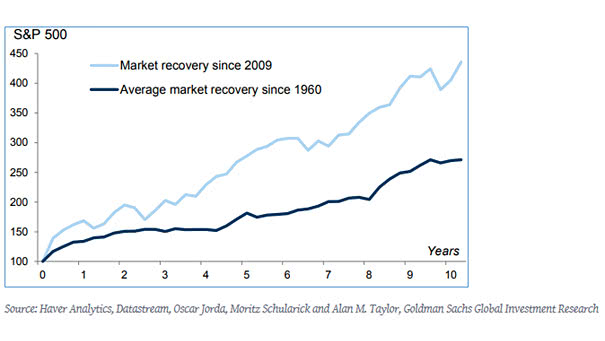
S&P 500 Recovery Since The Financial Crisis The chart shows that the S&P 500 has outperformed its historical recoveries since 2009. Image: Goldman Sachs Global Investment Research
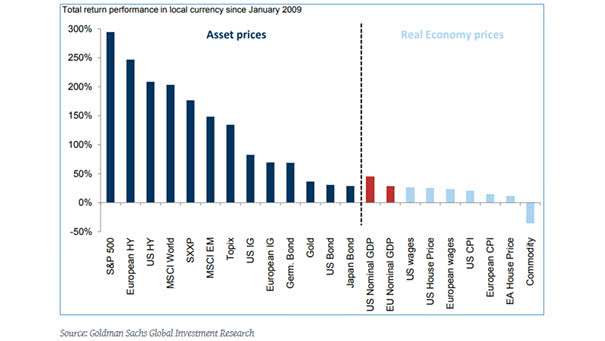
Asset Classes Total Return since the Great Recession The chart shows how asset classes and economic indicators have performed since the Great Recession. The S&P 500 is the big winner. Image: Goldman Sachs Global Investment…
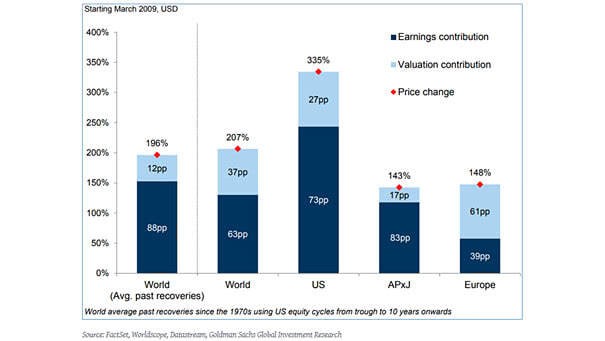
U.S. Equities and The World: Earnings Growth vs. Multiple Expansion Since the 2009 low, the strong performance of the U.S. markets comes from earnings growth (73%) and multiple expansion (27%). You may also like “S&P…
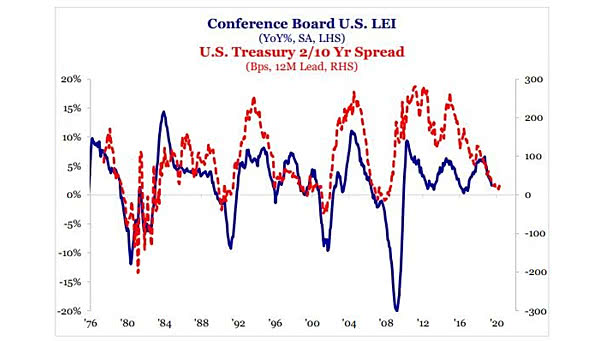
Conference Board U.S. LEI and U.S. Treasury 10-Year/2-Year Spread Is a rate cut justified in July? Just take a look at the Conference Board Leading Economic Index and the U.S. Treasury 10-Year/2-Year spread. Image: Strategas
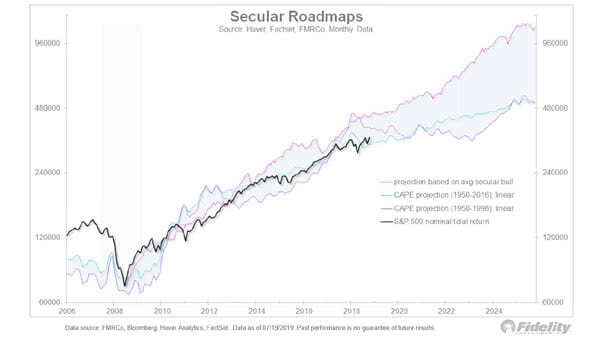
S&P 500 – Secular Roadmaps The chart shows the S&P 500 projection based on average secular bull and the CAPE model. Image: Fidelity Investments