Weekly AAII Investor Sentiment Survey
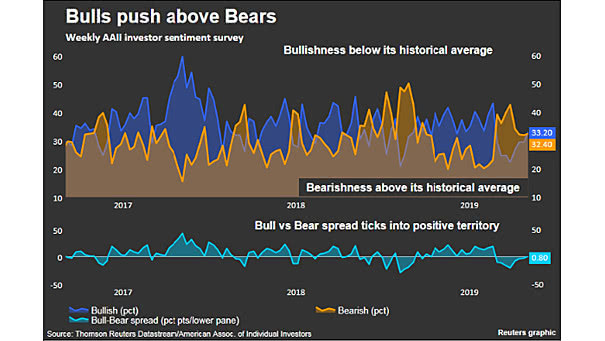
Weekly AAII Investor Sentiment Survey Bulls push above bears, but when doubt and fear are still present, it does not usually look like a major market top. Image: Reuters
Weekly AAII Investor Sentiment Survey Bulls push above bears, but when doubt and fear are still present, it does not usually look like a major market top. Image: Reuters
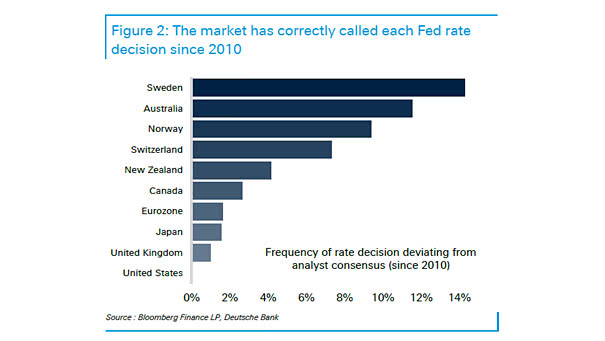
The Market Has Correctly Called Each Fed Rate Decision since 2010 And since 1994, seven days before a FOMC meeting, the market has been accurate 95% of the time. You may also like “The Fed…
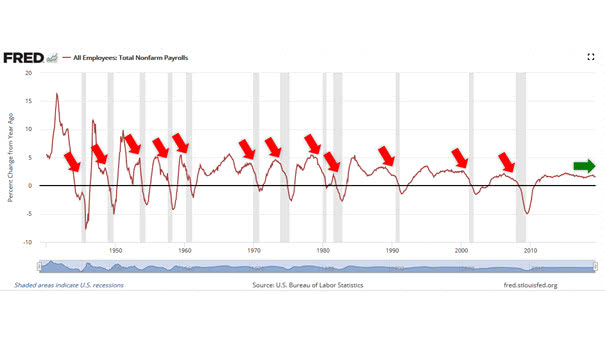
U.S. Total Nonfarm Payrolls and Recessions Total nonfarm payrolls increased 224K in June, well above expectations, which should calm fears of a near-term recession. The job market is still strong, even if there are signs…
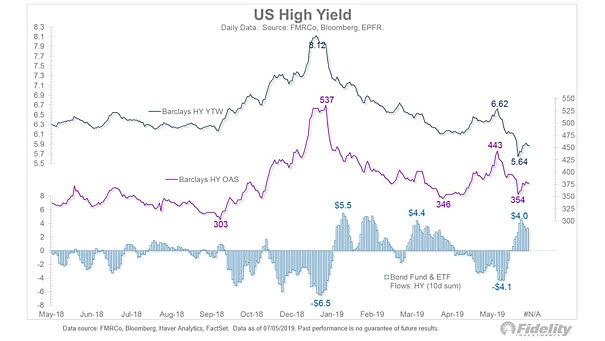
U.S. High Yield Credit spreads are fine. Could the market go wrong by predicting significant interest rate cuts? Image: Fidelity Investments
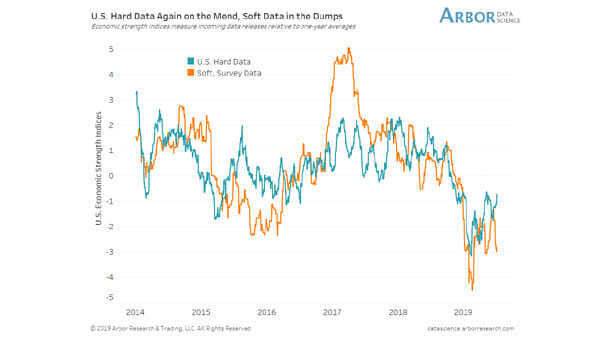
U.S. Hard Data vs. Soft Data U.S. hard data is improving, but the chart shows the current divergence between U.S. hard data and soft data. Image: Arbor Research & Trading LLC
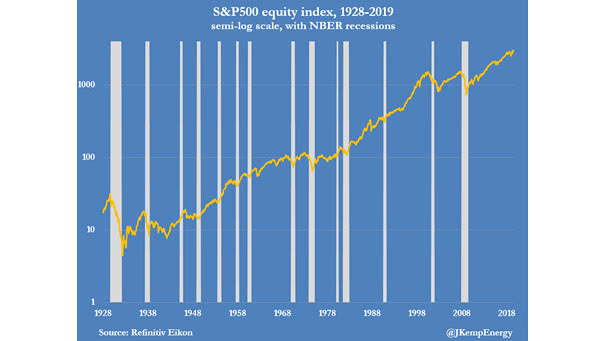
S&P 500 Equity Index since 1928 This chart puts into perspective the current record levels of the S&P 500. You may also like “The Stock Market Continues to Climb the Wall of Worry.” Image: John…
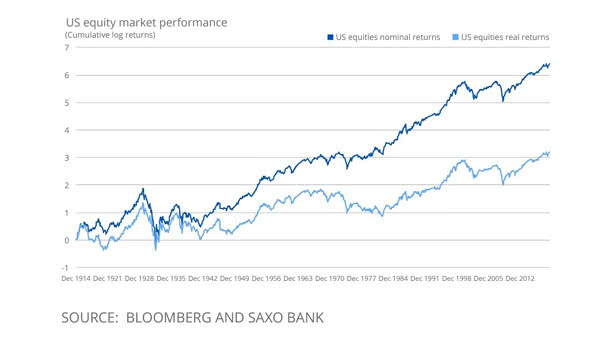
U.S. Equity Market Performance since 1914 Excellent comparison between real (adjusted for inflation) and nominal returns on U.S. equities. Image: Saxo Bank
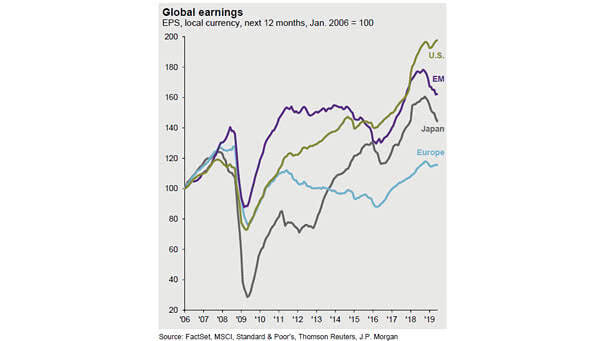
Global Earnings since 2006 This chart shows global earnings since 2006 (USA, Emerging Markets, Japan and Europe). As Warren Buffett said: “for 240 years, it’s been a terrible mistake to bet against America.” This chart below…
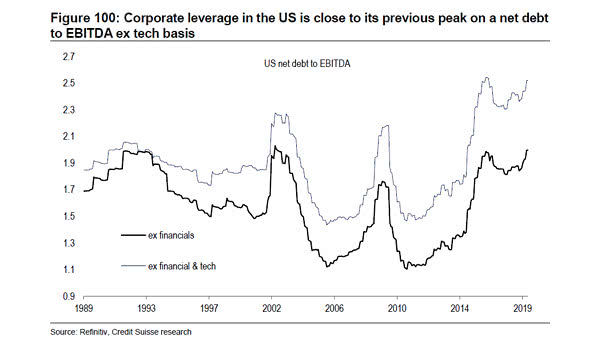
Corporate Leverage in the U.S. U.S. corporate debt is high. This chart shows that U.S. corporate leverage is close to its previous peak on a net debt to EBITDA. You may also like “U.S. Leveraged…
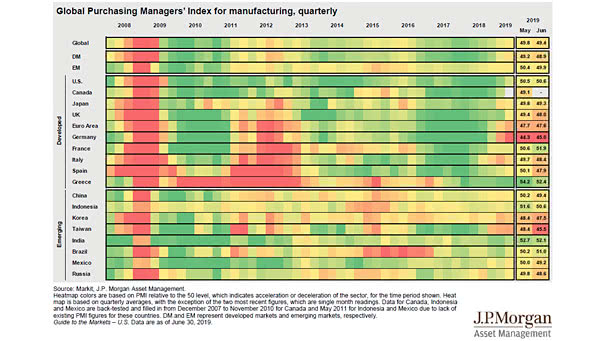
Global PMI for Manufacturing Global PMI for manufacturing slides to lowest since 2012. Image: J.P. Morgan Asset Management
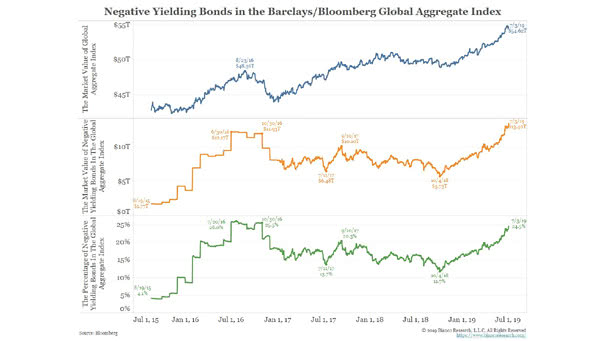
Negative Yielding Bonds in the Barclays/Bloomberg Global Aggregate Index These charts put things into perspective. Keep in mind that bondholders will get back less than what they paid if they hold bonds to maturity. Negative…