New Secular Bull Market?
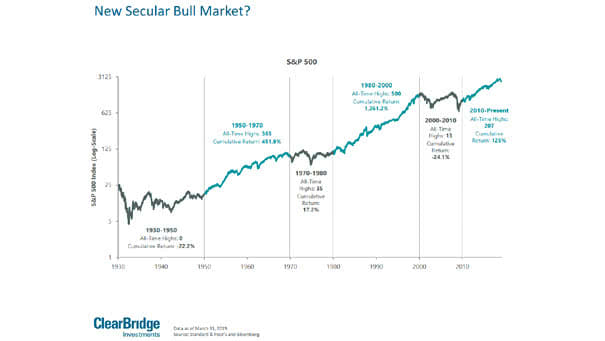
New Secular Bull Market? This chart shows a perspective on secular bull and bear markets since 1930. Picture Source: ClearBridge Investments
New Secular Bull Market? This chart shows a perspective on secular bull and bear markets since 1930. Picture Source: ClearBridge Investments
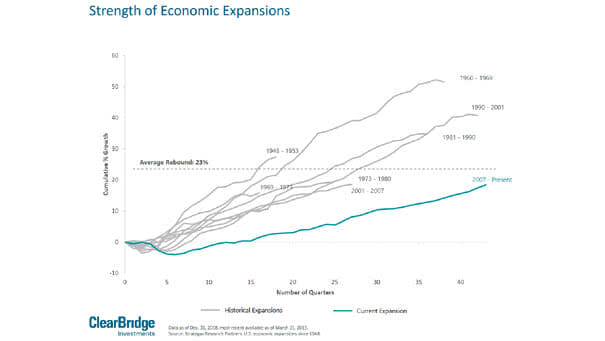
Strength of Economic Expansions The current business cycle is the longest expansion, but it’s also the weakest. Picture Source: ClearBridge Investments
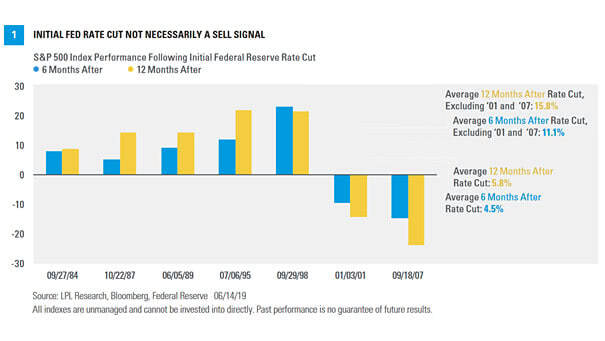
Fed Rate Cut Is Not Necessarily a Sell Signal This chart shows the S&P 500 Index performance, 6 and 12 months after an initial Federal Reserve rate cut. You may also like “S&P 500 Performance…
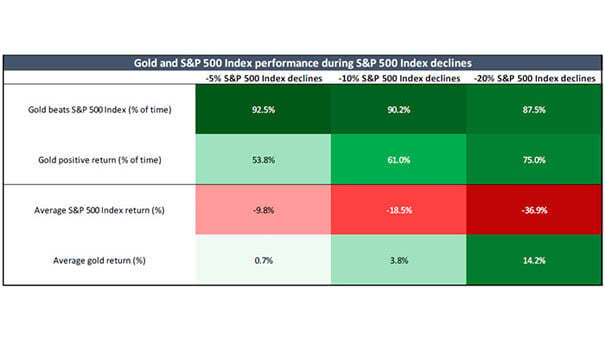
Is Gold a Good Asset When Stock Prices Are Falling? This chart shows gold and S&P 500 index performance during S&P 500 declines. Image: Wells Fargo Investment Institute
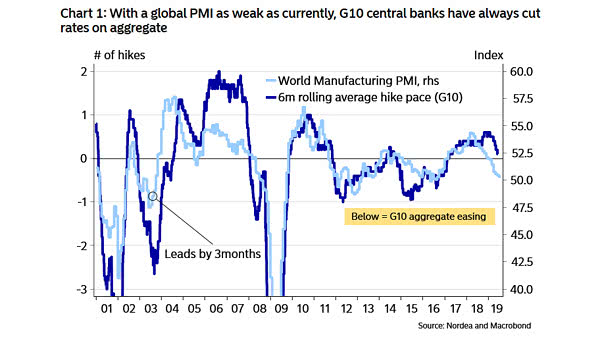
Global PMI vs. G10 Central Banks Rates Cut When Global PMI is weak, as is currently the case, G10 central banks have always cut rates. Image: Nordea and Macrobond
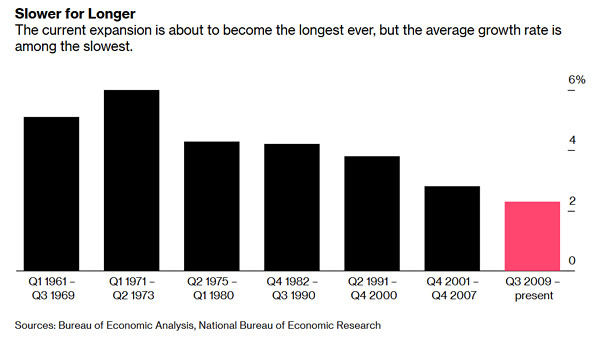
To Date, the Longest U.S. Expansion in History However, this chart shows that the average growth rate of the current expansion is among the slowest. Image: Bloomberg
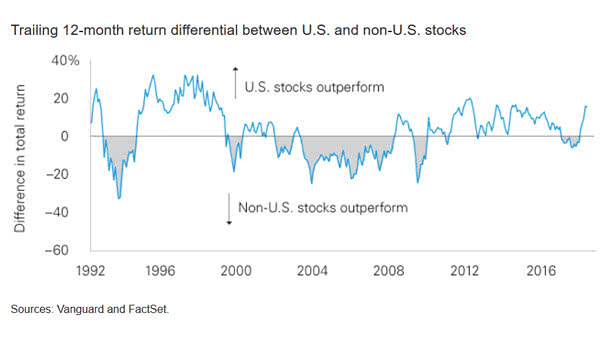
Trailing 12-month Return Differential between U.S. and non-U.S. Stocks Not so long ago, international stocks led the way over U.S. stocks. They could beat US stocks over next decade. Image: Vanguard
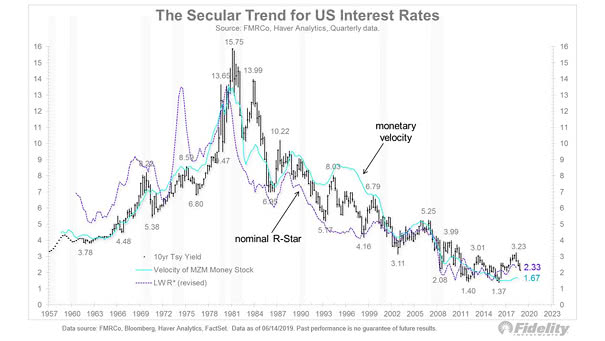
The Secular Trend for U.S. Interest Rates This nice chart shows the U.S. 10-year Treasury yield against the natural rate (nominal R-Star) and monetary velocity. In a sense, it explains the secular trend for U.S.…
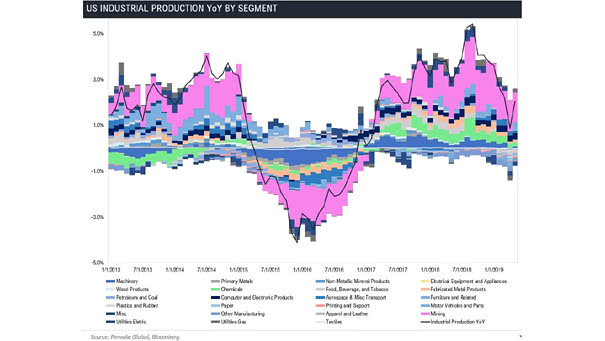
U.S. Industrial Production YoY by Segment since 2013 Another excellent chart showing the U.S. industrial production by segment. Image: Pervalle Global

Just a Normal Day… “Just a normal day at the nation’s most important financial institution…” Image: Kevin “Kal” Kallaugher
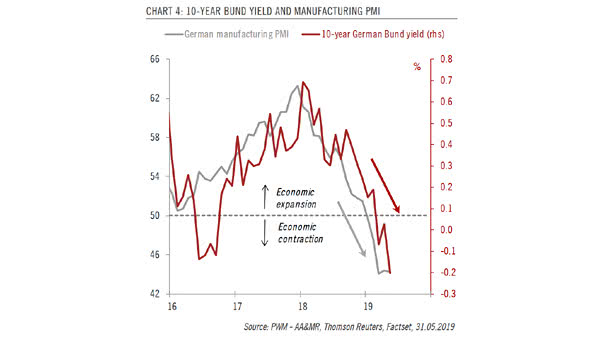
10-Year German Bund Yield and German Manufacturing PMI The 10-year German Bund yield could go positive again as recession fears dissipate. Image: Pictet Wealth Management