How Does Education Affect the Unemployment Rate?
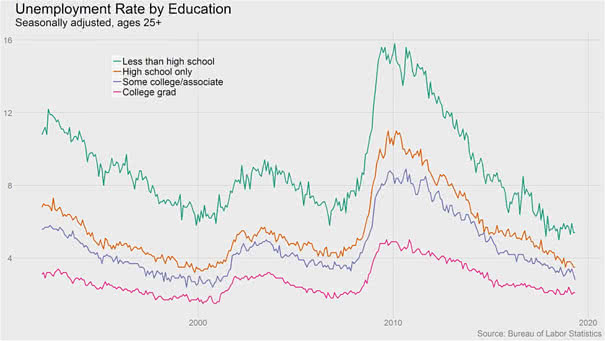
How Does Education Affect the Unemployment Rate? The chart below shows the unemployment rate by education and the importance of education for the unemployed. Image: Ben Casselman
How Does Education Affect the Unemployment Rate? The chart below shows the unemployment rate by education and the importance of education for the unemployed. Image: Ben Casselman
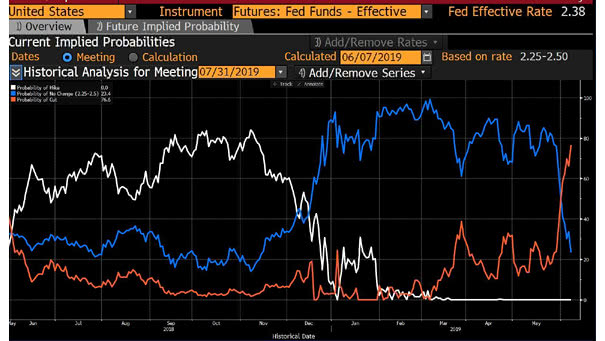
Probability of Fed Rate Cut in July 2019 Probability of Fed rate cut in July 2019 at 77%. Image: Bloomberg
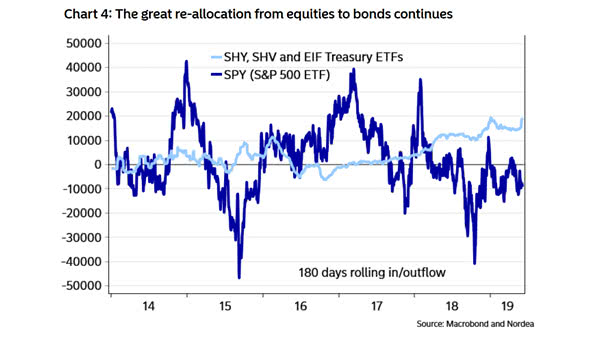
The Great Re-allocation from Equities to Bonds Continues Since the end of 2018, S&P 500 ETFs have seen outflows, while long Treasury ETFs have seen inflows. Image: Macrobond and Nordea
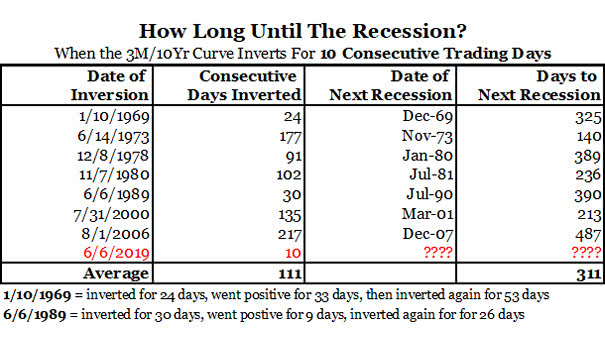
Yield Curve Inversion, How Long Until The Recession? In recent history, once the 10-Year minus 3-Month Treasury yield spread is negative and hits 10 consecutive days, it persists for weeks/months. When an inverted yield curve…
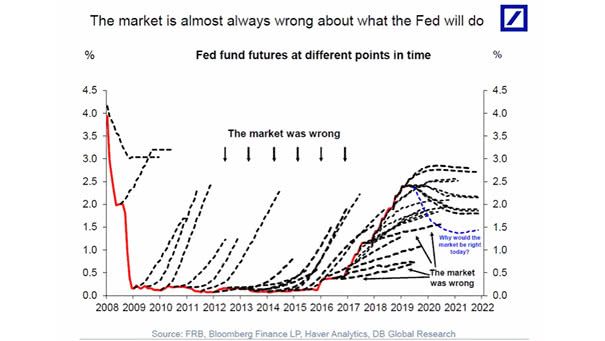
The Market is Almost Wrong about What the Fed Will Do Actually, the Fed decides when to raise rates. But the market decides when to cut rates: “Markets have accurately priced in cuts before easing cycles…
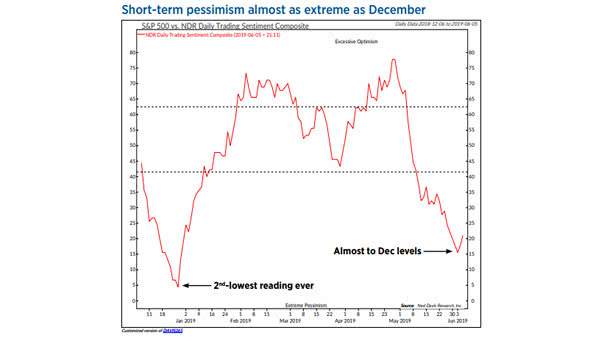
Short-term Pessimism Almost as Extreme as December The trade war and tariffs scared the stock market. Short-term pessimism is generally a good contrarian indicator, especially at a time when the media seem to be worried…
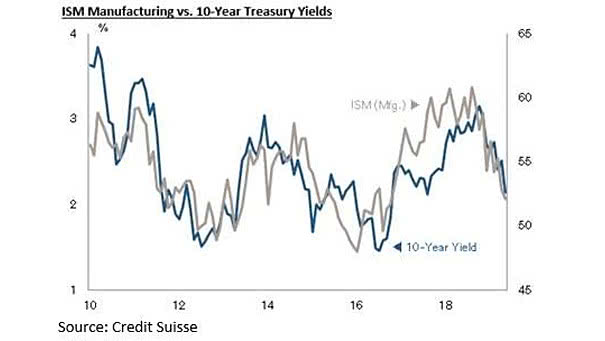
ISM Manufacturing vs. 10-Year Treasury Yields This chart shows a nice correlation between ISM manufacturing index and 10-year Treasury yields since 2010. This chart can explain why 10-year Treasury yields have fallen. PMI index above…
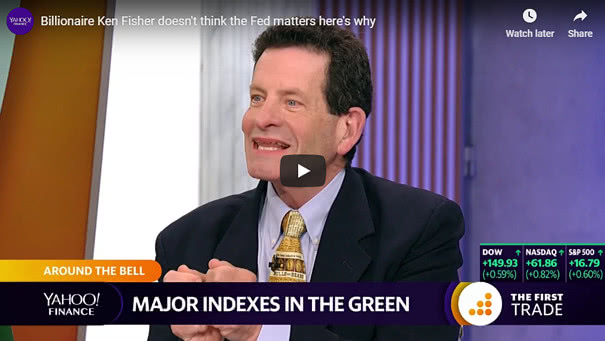
Billionaire Ken Fisher Doesn’t Think the Fed Matters Here’s Why Another great interview with Ken Fisher: “It is a bull market, but people are too focus on the negative.” Keep in mind that knowledge is…
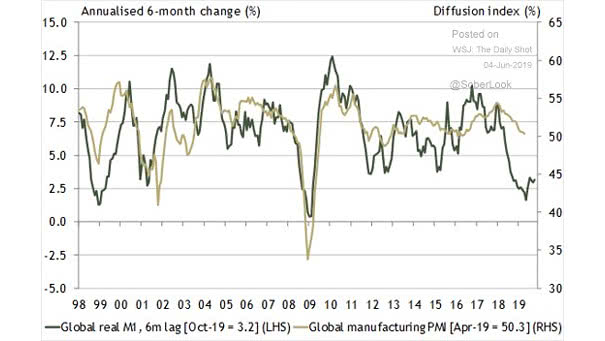
Global Real M1 Growth Leads Global Manufacturing PMI by around 6 Months When global real M1 money supply growth is very low, it does not bode well for global economic activity. Image: The Wall Street…
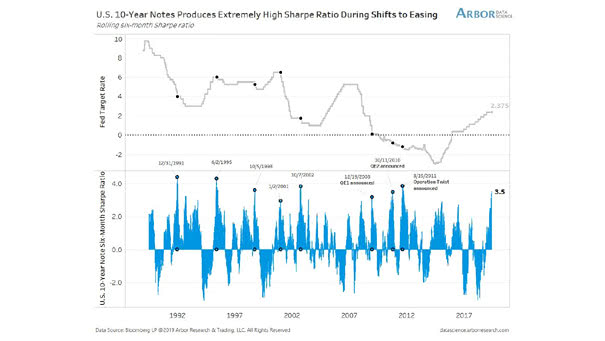
U.S. 10-Year Treasury Note Produces Extremely High Sharpe Ratio During Shifts to Easing This chart shows the high sharpe ratio of U.S. 10-Year Treasury Note during easing policy shifts. Image: Arbor Research & Trading LLC
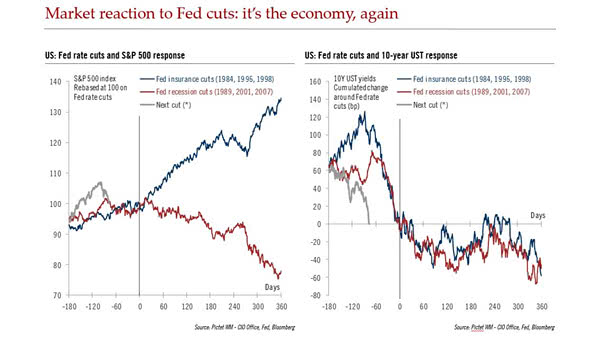
Market Reaction to Fed Insurance Cuts vs. Fed Recession Cuts This chart shows the S&P 500 and 10-year Treasury Note response to Fed insurance cuts vs. Fed recession cuts. There is a big difference for…