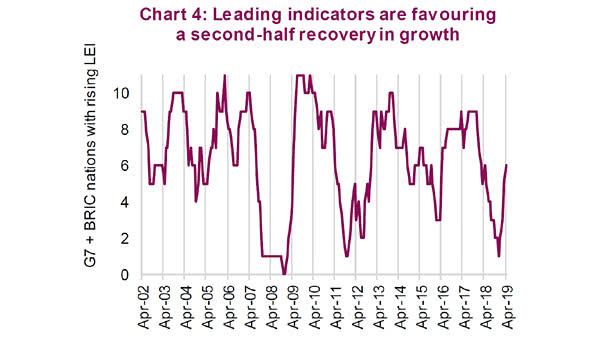
Second-half Recovery in Growth?
Second-half Recovery in Growth? Better economic data could extend the business cycle. Currently, G7 & BRIC leading indicators remain encouraging and suggest no imminent recession. Image: Richardson Wealth
Second-half Recovery in Growth? Better economic data could extend the business cycle. Currently, G7 & BRIC leading indicators remain encouraging and suggest no imminent recession. Image: Richardson Wealth
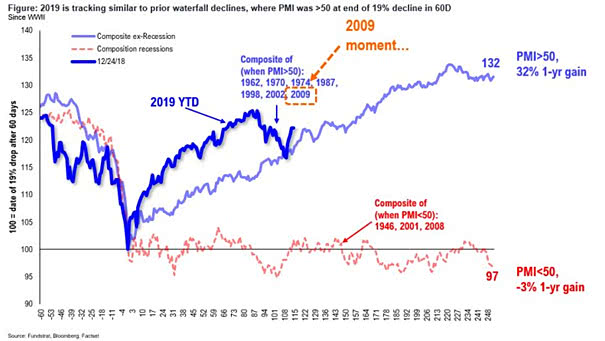
2019 Is Tracking Similar to Prior Waterfall Declines Where PMI was above 50 at end of 19% decline in 60 days. So, it suggests 3,100 for the S&P 500 by year end. Image: Fundstrat
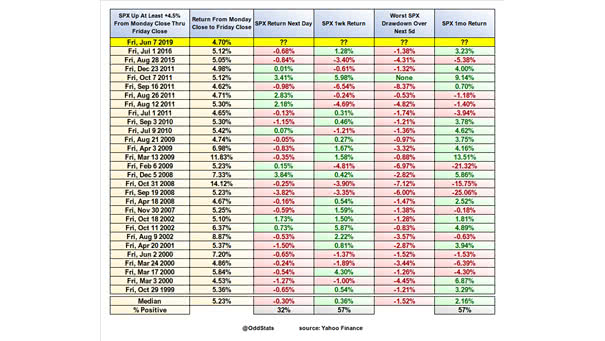
S&P 500 Up at Least +4.5% from Monday Close through Friday Close Last week, the S&P500 was up at least +4.5% from Monday’s close through Friday’s close. History shows it is not bullish. Image: OddStats
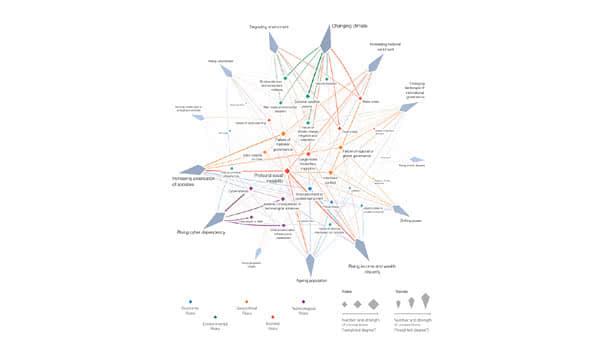
The Top 10 Risks to the Global Economy US-China trade conflict, US corporate debt burden, and emerging-markets crisis are the main global risks according to the Economist Intelligence Unit (EIU). Image: World Economic Forum
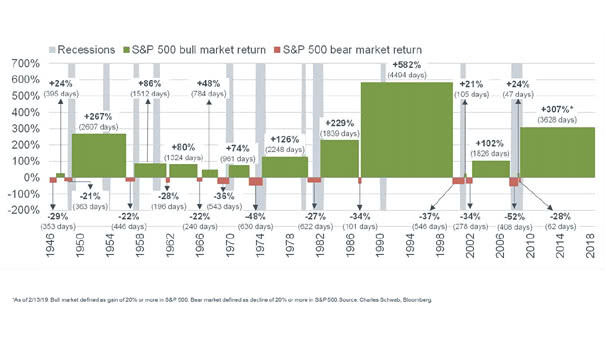
Fear Of Recessions? S&P 500 Bull and Bear Markets since 1946 A long-term investor should put downturns in perspective. Image: Charles Schwab
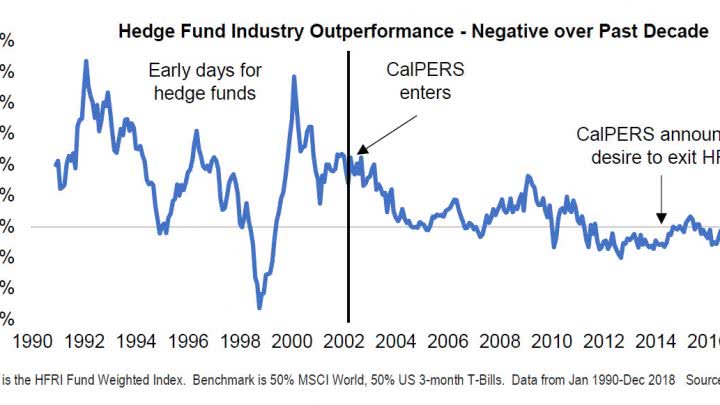
Hedge Fund Industry Outperformance – Negative over Past Decade The chart below shows how it’s hard to beat the market over time. Image: Greenline Partners LLC
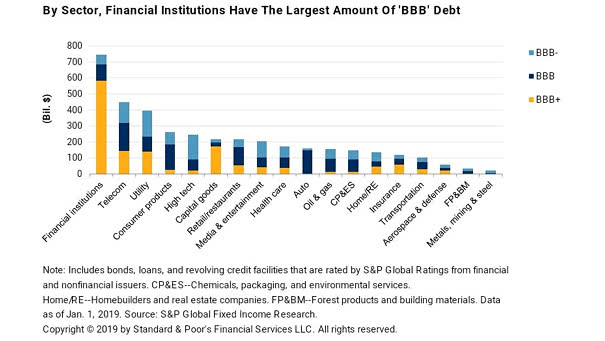
BBB Debt by Sector in the U.S. By sector in the U.S., financial institutions have the largest amount of ‘BBB’ debt: $744 billion. That’s 53% of investment-grade bonds in the United States. You may also like…
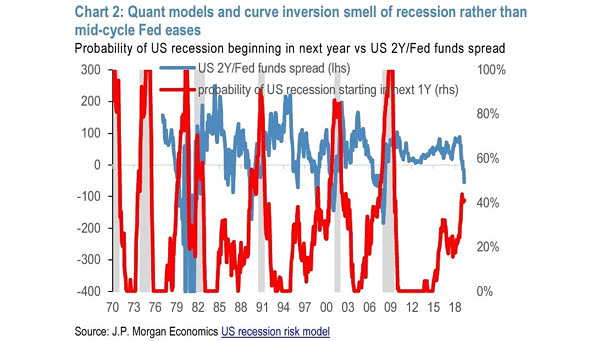
Market Smell A Recession As Yield Curve Inverts Quant models and yield curve inversion smell of recession rather than mid-cycle Fed eases. Image: J.P. Morgan
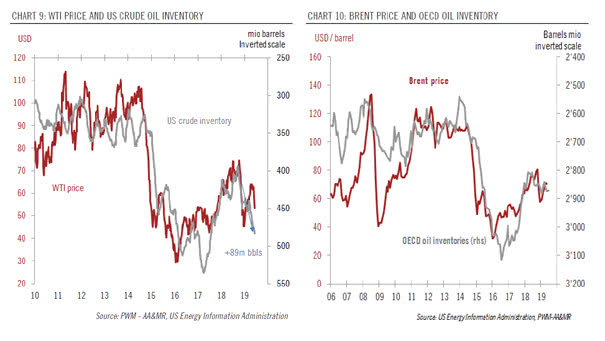
WTI Price and Brent Price vs. Oil Inventory Oil inventories suggest that the price of oil is currently fairly priced. Image: Pictet Wealth Management
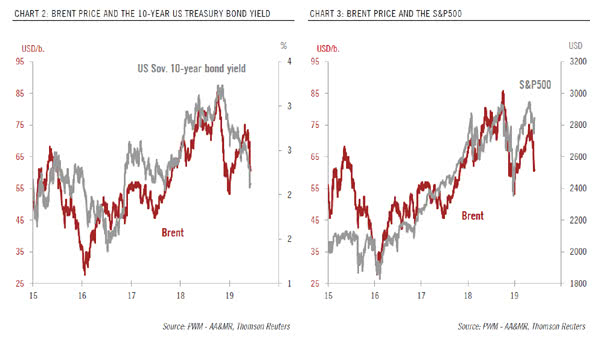
Brent Price vs. 10-Year Treasury Bond Yield vs. S&P 500 This chart shows that oil prices are a good indicator of global economic growth and investors are concerned about a global economic slowdown. Image: Pictet…
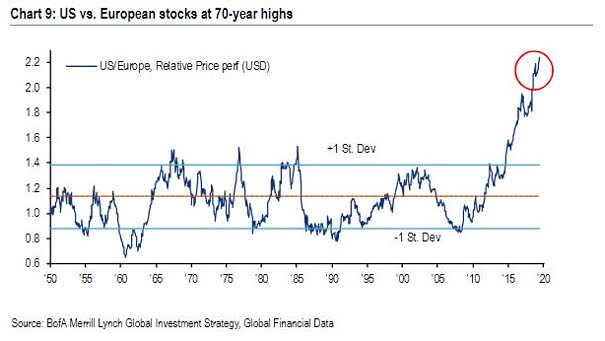
Could European Stocks Outperform U.S. Stocks? This chart shows U.S. vs. European stocks at 70-year highs. Keep in mind that investors think that the euro area economy is less resilient than the U.S. economy in…